by Jim the Realtor | Feb 22, 2023 | Inventory, Jim's Take on the Market, North County Coastal |
Remember when the inventory tanked in 2020 when everyone was afraid of catching the bug?
Once the pandemic was over, we’d get back to the regular flow of homes for sale, wouldn’t we?
But the intensity seemed to increase as time went on, finally spinning out of control when mortgage rates went up. The resulting debris field is causing fewer people to want, or need, to sell.
For most, staying put seems like the best option, at least for now.
Buyers can probably endure another year on the lease. But potential sellers are getting closer and closer to being too old to move. If there isn’t a clear path to living for another 5-10 years (and hopefully longer) in your new town, you’re probably going to decide to live it out where you are.
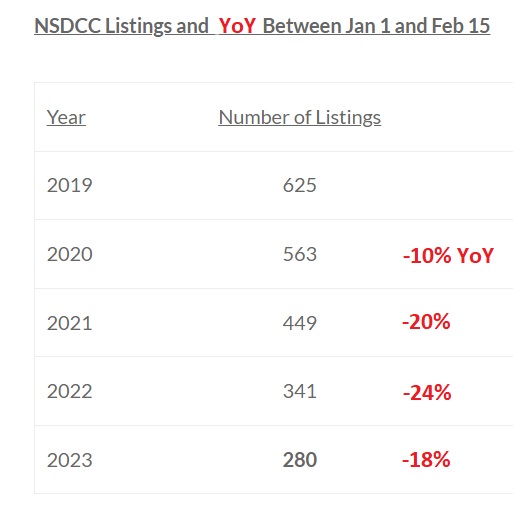
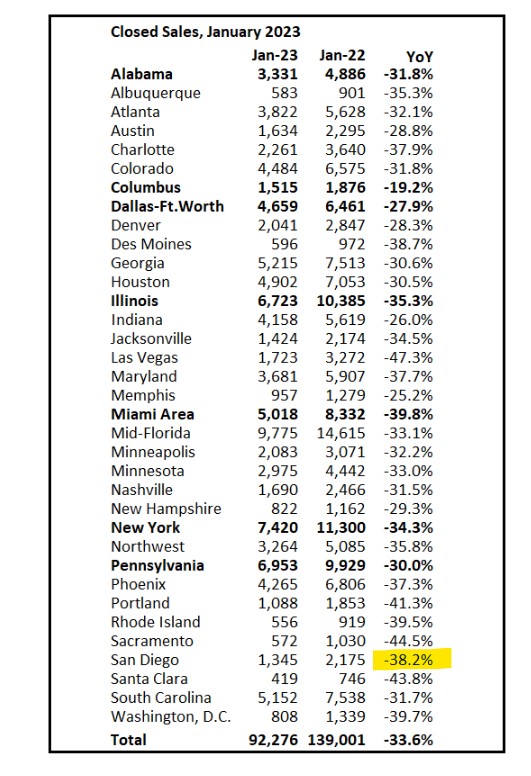
The NSDCC YoY change in January was only -17%, so only half as bad as San Diego in general. But the first 15 days of February are -20% YoY, so the local inventory isn’t exactly getting better.
The drop from 2019 is 55%!
by Jim the Realtor | Feb 21, 2023 | 2023, Jim's Take on the Market, North County Coastal
Let’s revisit yesterday’s graph and add the sales to compare the relative health of the market.
If higher mortgage rates were stopping home buyers, then sales would plummet, especially in relation to the number of listings. But if the number of listings plummets too, and we’re down to just the most serious buyers and sellers, we can still have an orderly market:
NSDCC Listings and Sales Between Jan 1 and Feb 15
| Year |
Number of Listings |
Number of Sales |
Listings/Sales |
| 2019 |
625 |
239 |
2.6 |
| 2020 |
563 |
253 |
2.2 |
| 2021 |
449 |
290 |
1.5 |
| 2022 |
341 |
226 |
1.5 |
| 2023 |
280 |
148 |
1.9 |
The local market isn’t in shambles or falling apart.
The number of buyers AND sellers are much lower than they were previously, but they are acting in concert and fairly similar to the frenzy years. By the time the late-reporters log in, this year’s L/S will get down to 1.8 or 1.7 which is remarkably similar to the hottest frenzy years of all-time!
by Jim the Realtor | Feb 14, 2023 | Bubbleinfo Readers, Contests, North County Coastal, Padres |
There were 182 NSDCC listings in January, as of today – which means we have a clear winner, even if a few more listings get added by late-reporters.
Congratulations Rob Dawg!
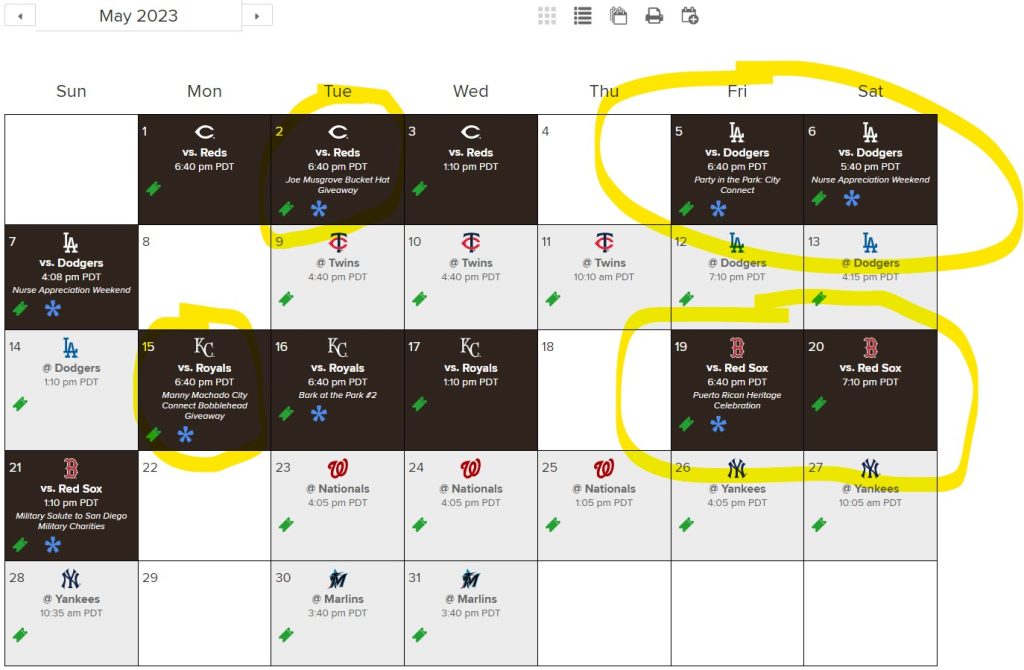
The season starts on March 30th, and May looks like a great month to attend a game. What might be the two best giveaways of the season (vs. the Reds and the Royals) happen that month, plus the Dodgers make their first visit back to Petco Park.
Dawg’s favorite team, the Red Sox, also return in May!
The summary of guesses, with some additions from the FB page:
16 Noodle
89 Momento
99 Tom
104 BWell_SoCal
111 Majeed
115 Lifeisradincbad
117 Susie
119 Beachside
120 Curtis
128 Joe
130 Rob
136 Skip
140 Haile
142 MC
146 Derek
152 Drew
158 Susan
160 doughboy
165 Kingside
174 SurfRider
175 Sciguy
186 Rob Dawg
190 Bode
200 Jeff Campbell
203 Lauren Stickelman
213 Shadash
252 Aunt Nancy
262 Eddie89
298 Nick
333 Sherman Messing
149 Median
This was the first time that the actual count of January listings landed in the upper third of the guesses. But don’t get giddy about the inventory just yet – here’s how it compares:
NSDCC January Listings:
2018: 426
2019: 418
2020: 354
2021: 289
2022: 223
2023: 182
The lack of choices is what causes hyper-frenzy conditions – it causes buyers to freak out. When a top-quality listing hits the market, buyers feel like this might be their only chance this month, or this year, to buy such a good match to their needs – and then the lack of transparency makes them go nuts.
It’s going to be a wild and crazy season – and not just for the Padres!
by Jim the Realtor | Feb 13, 2023 | 2023, North County Coastal, Spring Kick |
When mortgage rates started going up last year, I said all we have to do is survive until springtime – and it looks like we’ve made it!
Not only did our local market not crash and burn, it held up pretty well – and that’s in spite of the higher rates and blistering doomer attack over the last eight months.
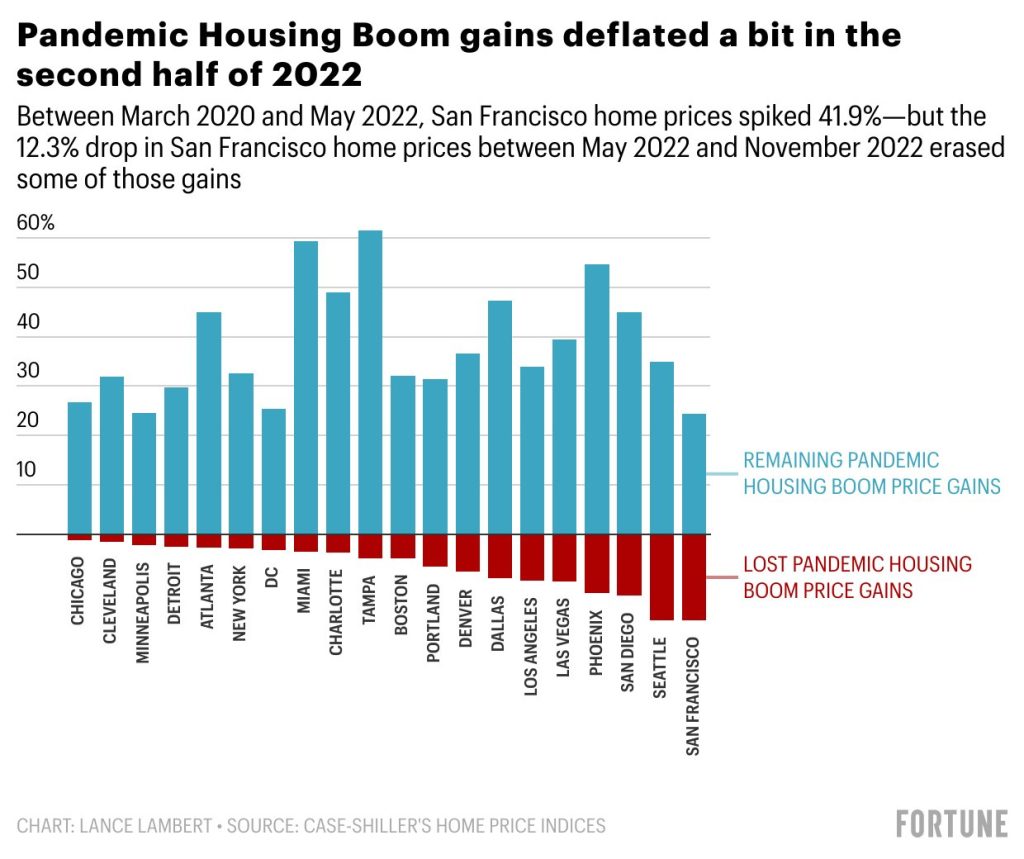
The San Diego Case-Shiller NSA stats:
Mar 2020: 268.19
May 2022: 421.29 (+57%)
Nov 2022: 390.22 (-7%)
I don’t know where the -7% is happening, but around the NSDCC, the pricing hasn’t changed much.
The spring season should run hot through May, and by then the mortgage rates AND prices will probably be higher. The second half of 2023 will likely be sluggish, at best.
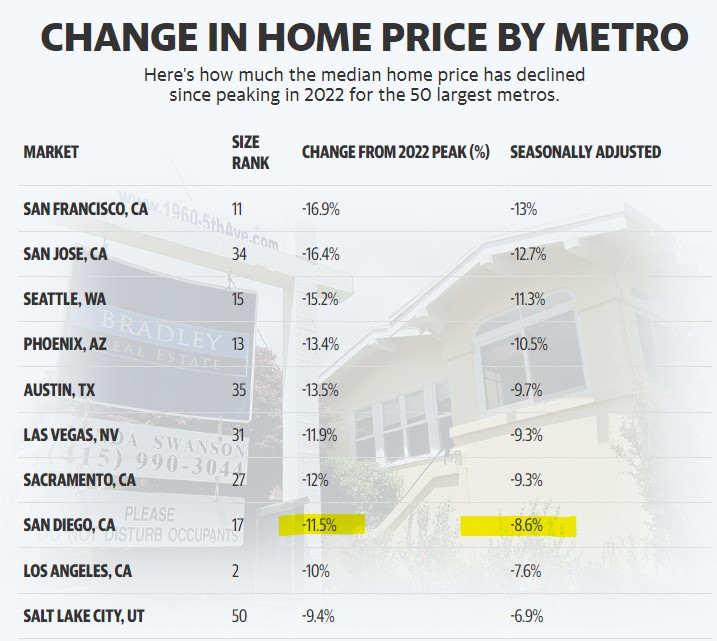
https://finance.yahoo.com/news/map-heres-where-home-prices-are-dropping-the-most-165428216.html
by Jim the Realtor | Jan 27, 2023 | Jim's Take on the Market, North County Coastal, Sales and Price Check |
I was confident that in the last few months of 2022 we would reach at least 100 detached-home sales between Carlsbad and La Jolla. We are up to 102 in December, after closing 118 in November!
I wasn’t so hopeful about January.
As of today, there have been 68 closings this month.
We could have more sales, because there are 269 active listings sitting around. But only those that deserve it (those that do everything right) will be selling now.
Those that get it right are being rewarded…..they are selling! You could say that pricing is on an upward trend too, if you rely on the lame and inadequate median sales price to guide your decisions:
NSDCC Monthly Sales and Pricing
| Month |
# of Sales |
Average SP |
Avg. SF |
Median SP |
Med. SF |
| November |
118 |
$2,447,009 |
3,094sf |
$1,887,500 |
2,647sf |
| December |
102 |
$2,682,523 |
3,064sf |
$1,897,500 |
2,596sf |
| January |
68 (so far) |
$3,206,653 |
3,646sf |
$2,222,500 |
2,833sf |
| Dec-Jan MoM Diff |
-33% |
+20% |
+19% |
+17% |
+9% |
Unfortunately, the dated and backward-looking Case-Shiller Index comes out next Tuesday, and the doomers will use it to convince you that the market is coming apart.
But because sellers are holding out, only the homes that deserve to sell will be closing in 2023, and they should get pretty close to what they want, price-wise. Except those represented by desperate agents who fail miserably at doing everything right, and then take a lowball offer.
With the lower number of sales, don’t be surprised if the median sales price fluctuates wildly.
Here are Bill’s thoughts on sales and pricing:
https://calculatedrisk.substack.com/p/has-housing-bottomed
by Jim the Realtor | Jan 25, 2023 | 2023, Forecasts, Jim's Take on the Market, Market Buzz, North County Coastal, Why You Should List With Jim |
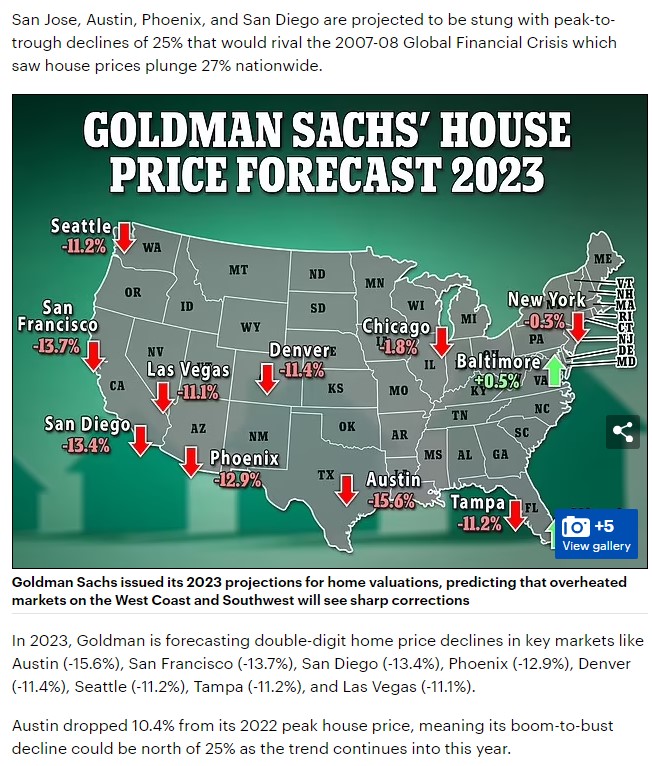
I was going to ignore one more forecast by a financial services company (what do they know about selling homes?), but this is from the squid, plus Derek mentioned it in the comment section.
None of these forecasts provide any evidence or reasons for their conclusions. They are just guessing, apparently, and merely searching for more eyeballs.
They are probably transfixed on the median sales price, one of the worst tools available.
San Diego County Detached and Attached Homes, Median Sales Price
April: $871,000
December: $757,250
Diff: -13%
There you go – the county’s median sales price has dropped 13% so far.
Do you see that much in the market?
I’ll give you a better example:
NSDCC Detached-Homes, Median Sales Price
March: $2,625,000
December: $1,895,000
Diff: -28%
Do you see houses between La Jolla and Carlsbad selling for 28% less than they did in March? Me neither. NSDCC sales dropped in half (207 vs 101), and the homes that are selling are smaller (average square footage is -13%) and more inferior which explains why the median sales price should be dropping. But nobody mentions the additional variables.
We are being dumbed down by the squid, and others.
Sellers should just wait it out.
Link to Article
by Jim the Realtor | Jan 20, 2023 | 2023, Frenzy Monitor, North County Coastal, NSDCC Pendings, Why You Should List With Jim
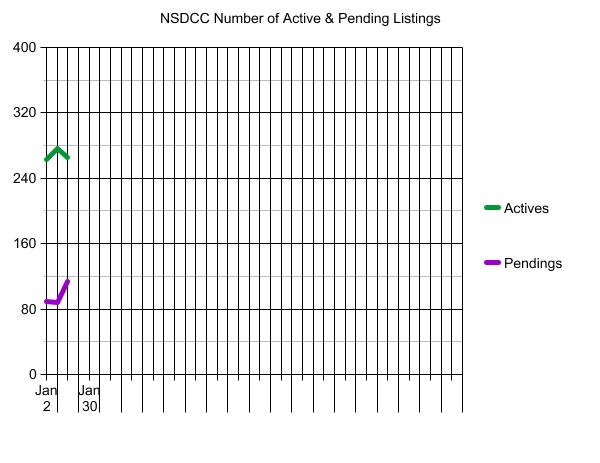
The reason for breaking down the active and pending listings by zip code is to give the readers a closer look at their neighborhood stats. We have considered a 2:1 ratio of actives-to-pendings to be a healthy market. When there were more pendings than actives, the frenzy was out of control, and when the number of actives reaches a 3:1 ratio of higher, you know that the market is going the other way.
Lately, the ratio has benefitted from cancellations, and today’s A/P ratio is close to the June level:
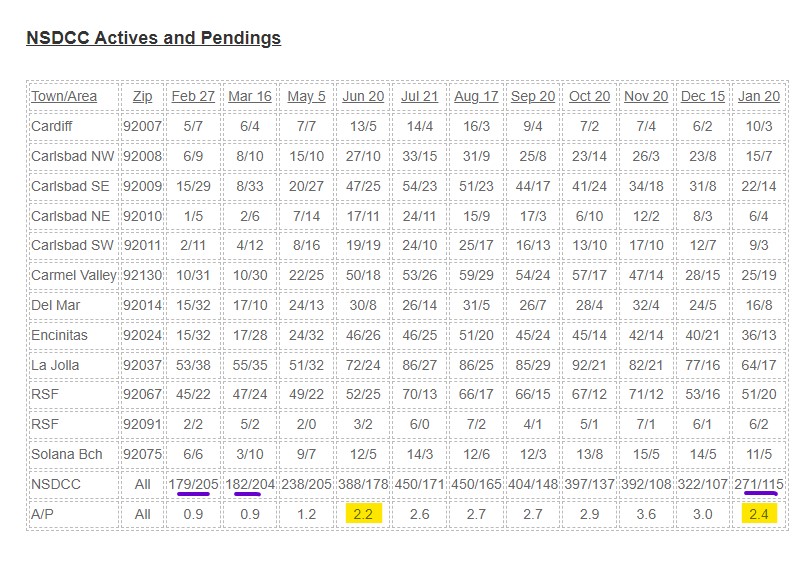
The number of choices today is anemic, and not that much different than the frenzy levels. The combined totals of actives and pendings (underlined in purple above):
Feb: 384
Mar: 386
Jan: 386
Fewer are selling now because of listing exhaustion.
Of the 105 new listings in January:
Number of those on the market in 4Q22, and refreshed as a new listing this month: 44
Number of January listings that were purchased in 2020: 13
Number of January listings that were purchased in 2021 or later: 19
You can say that the inventory of exciting new offerings is extremely tight, especially for those buyers who have been looking since 2020 – you’ve previously seen 72% of the ‘new’ listings.
In 2020, we had 400+ pendings from June 22nd to November 30th – with a peak of 491 pendings on September 7th.
by Jim the Realtor | Jan 19, 2023 | North County Coastal, NSDCC Pendings, Why You Should List With Jim |
The chart above shows that there were 61 new NSDCC pendings through January 16th last year – when mortgage rates were in the low-3s and we were in full frenzy mode.
Through the 18th, there are 62 new pendings this month!
We are on about the same pace as last year? Who woulda thunk it?
by Jim the Realtor | Jan 17, 2023 | 2023, North County Coastal, NSDCC Pendings, Why You Should List With Jim
Yesterday, we saw that there has been a flurry of new pendings this month.
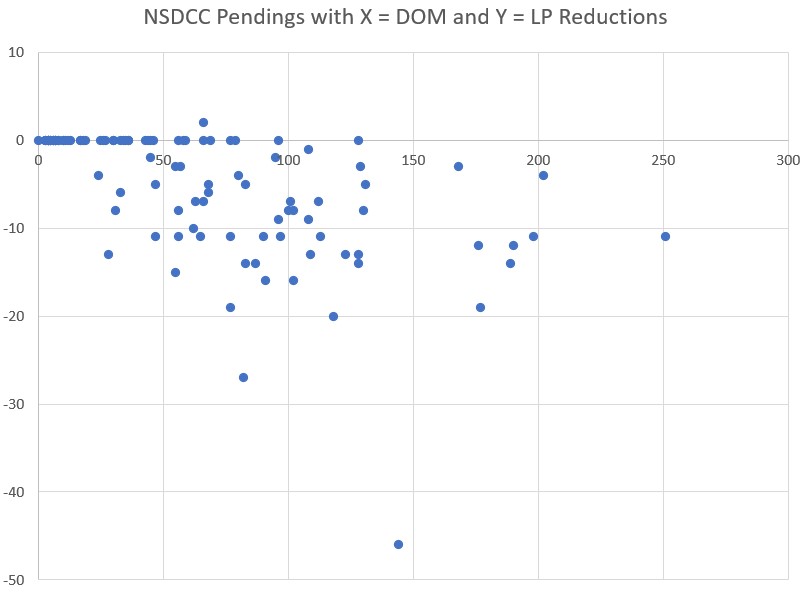
Could it be a result of brave buyers who have lowballed the sellers? We won’t know until they close escrow. But there is a direct correlation between how long a home has been on the market, and the discount expected by the buyers.
Of the current pendings, 49% didn’t lower their list price – and the median days on market for the whole group is 17 days. If the price is attractive, buyers will step up in the first two weeks and pay it, or close.
But once a NSDCC home is on the market for more than a month, and it can be a slippery slope – mostly because the showings dry up. Unless the sellers are willing to pour (more) money into upgrades, then the next best solution is to lower the price – but once you start lowering, it invites the lowballers. Yes, there were a handful that still went pending without reducing, but those were mostly the high-enders:
You see realtors advertising today to sellers that they need to price their home ‘right’. It’s a bit insulting, if you ask me, because it means they want you to price it at their price, not yours.
An attractive price is more than just money – it sums up the whole package (location, floor plan, condition, ease of showing, and listing agent competence) and causes the buyers to say, “Hey, that’s a nice deal!”
by Jim the Realtor | Jan 16, 2023 | Inventory, North County Coastal, NSDCC Pendings
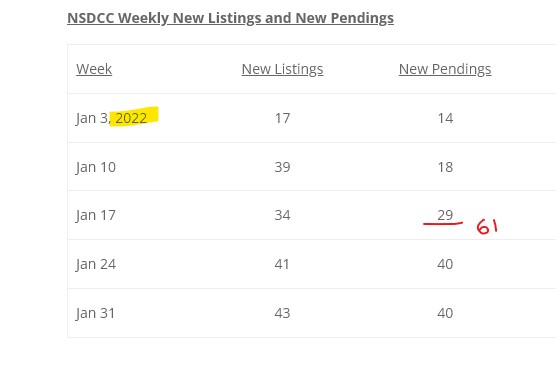
A fantastic start to the new year!
In the last week, there were 36 new listings and 34 new pendings! In the previous week, we also had 36 new listings but only 15 new pendings.
The total pendings count increased +30% in a week!
In the Under-$3,000,000 market, there are 119 actives and 86 pendings, which looks remarkably healthy.
We are about halfway through January, and there have been 80 new listings so far between La Jolla and Carlsbad. It means our contest should wind up around 160-170 listings.
(more…)


