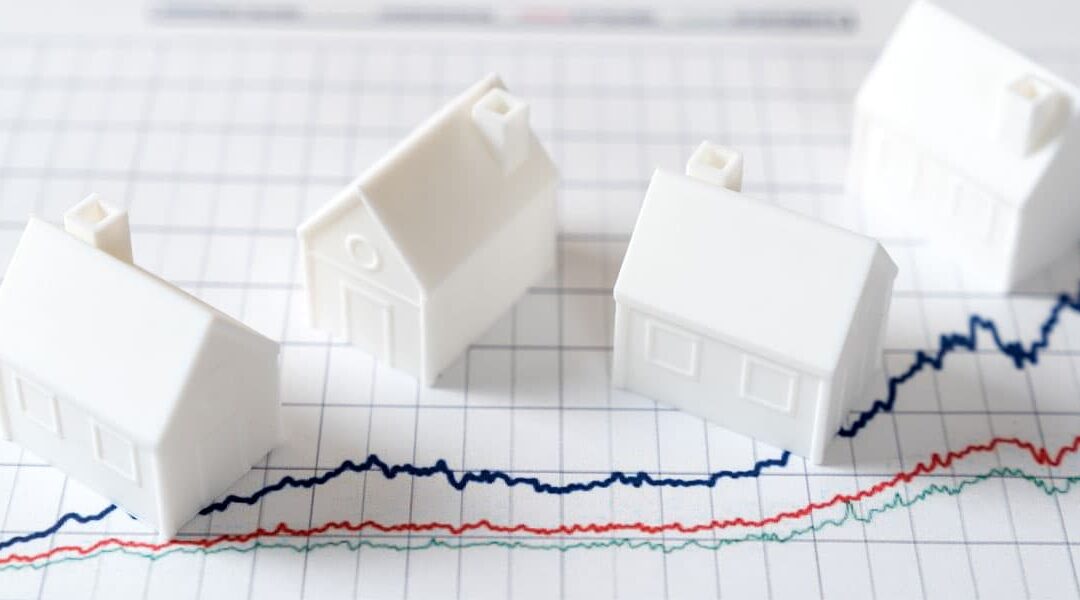
NSDCC Actives and Pendings The local markets are sinking further into a stallout that will probably last for the rest of the year. Actives are up 27%, and pendings down 16%, year-over-year. Yikes!
Frenzy Monitor
read more

NSDCC Actives and Pendings The local markets are sinking further into a stallout that will probably last for the rest of the year. Actives are up 27%, and pendings down 16%, year-over-year. Yikes!
NSDCC Actives and Pendings We looked at the somewhat-gloomy San Diego County stats, so let's also examine the individual areas around the north county coastal region. Comparing year-over-year, it looks a little gloomy here too. The areas in red have worse numbers...
The unsolds are rising quickly with +96 since mid-February. In 2024, we didn't have 462 active listings until the middle of June! But South Carlsbad and Carmel Valley are cruising along nicely with their actives-to-pendings ratios within the 2:1 standard we use to...
Frenzy may not sound applicable these days.....but look at La Jolla getting off to a hot start and leading the pack with 38 pendings, just like last year! The 92067 is angling towards their pre-covid standard with a 9:1 ratio of actives-to-pendings. Our normal gauge...
Compared to last February: NSDCC Active Listings: +18% NSDCC Pending Listings: -10% "We're losing so slowly that it almost feels like winning", Gary Keller
So far, 2025 is looking a lot like 2024! Last year was fantastic, statistically, so if we just mirror those results then this should be a terrific year for local real estate.
There are 20% more active listings, and 21% more pendings than we had last December - a monthly trend here in the fourth quarter of 2024 as the demand is keeping up with the supply. Compare it to August when there were 26% more homes for sale year-over-year, but 17%...
La Jolla hit the century mark in active listings but with 28 pendings it seems to be in decent shape. It's Rancho Santa Fe that is angling back to its favored 10:1 ratio of actives to pendings.
In La Jolla and Rancho Santa Fe - where being priced to sit is an art form - the active listings are piling up and are at their highs of the year. On the other hand, Carmel Valley is cruising along with their actives-to-pendings ratio is well under our 2:1 healthy mark.
Compared to last year, there are 25% more sellers not willing to get realistic about the value of their home. It's fine, as long as they don't mind waiting for all the other better buys to clear out - and it might be a loonnnggggg wait. The median days on market for...


