I’ve been sitting on this photo for about ten years so it’s about time!
The vice president and I have things in common. We were both born in Oakland and she got her start at the same place my grandfather did. Her law career began in 1990 at the Alameda County’s District Attorney’s office – my grandfather was there from 1923-1969, including his 22 years as the district attorney.
My brother’s wife Jill worked at the DA’s office at the same time as Kamala (circled above)!
What does Kamala’s ascent to the top of the ticket mean for home sales?
Biden dropping out of the race has to provide some calming to the real estate market, especially in gloomy blue states where hope was dismissed about three weeks ago. Even though local sales have been healthy, if the hopium causes a critical 10% to 20% of extra demand then we could see a surge over the next 30+ days.
She is a fantastic speaker, and it won’t take long for the polls cast doubt on the outcome. Even if she loses, she will provide enough comfort for the rest of 2024 that our market should survive quite nicely.
As long as nothing gets too negative, home sales should be fine!
The other real estate reality shows are so full of drama that they are barely watchable. While they do pack some drama into Ryan’s new show, Owning Manhattan on Netflix, they mix in a few examples of him doing a masterful job of negotiating between agents and principals to make deals. Specifically, listen to his verbal discipline when talking on the phone – Ryan says very little, and keeps all the attention on the price – no stories or verbal vomiting.
He demonstrates a realtor’s most important job:
Say the right things, the right way, at the right time.
And he could give you the list of the things to say – it’s saying them the right way, at the right time that makes the difference between highly productive agents, and the rest.
He makes it look easy, but the mental discipline to gently yet succinctly assist people with making the right decisions is an art form and extremely uncommon.
I watched the eight episodes that have come out and thought Ryan’s negotiating was the most accurate representation of high-level agent deal-making that has ever been documented. Ryan also loses three key agents during the first season, which is another part of the business – agents are known to move around, and aggressive recruiting (particularly by Compass) is a constant threat.
This is just the trailer – if you are an agent or big fan of real estate, watch the whole series:
Floyd Wickman said it best. Don’t sell with blah blah, when you can sell with blah.
Oh, the 5-offer bidding war with my buyers? After a week of kicking it around, the listing agent finally called last night. Her sellers decided to not conduct a legit bidding war (even though the listing agent had promised it all week) and instead they sold the house to a neighbor at an under-market price.
It was a great example of how most potential bidding wars get botched by amateur listing agents. The realtor doesn’t take control of the situation and it just goes where it goes – and buyers get screwed.
I was on a national sales call yesterday where agents from coast-to-coast were complaining about how bad their market is currently. I kept thinking, “It’s nothing price won’t fix!”
Instead, the common fallacy that ‘it just takes longer to sell a home‘ will prevail.
It’s been a belief among sellers and agents for decades. Could it be wrong? Yes.
Of the 21 NSDCC closings over the last 30 days that sold for $5,000,000+, the median time that it took to find the buyer was 34 days. Of the 17 homes in escrow today that are priced over $5 million, the median market time is 31 days.
Why does the belief keep lingering? It’s because it’s easier to digest than “Your price is wrong”.
How does the market really work? The house that sells today is the one that is the best deal for sale.
All a seller has to do is price their home to be the best deal on the market. They can do it from the beginning and get into escrow in the first week or two, or they can wait for weeks or months before getting their price right. Some get lucky when strong demand clears out all the better deals in a hurry, causing the over-priced-turkey to look competitive quickly. It’s just dumb luck though, rather than a deliberate strategy, because it can go the other way too when newer listings at lower prices leave the OPT high and dry.
This is the type of market where some listings will never sell. They price too high from the beginning, never adjust, and they just help to sell the better-priced listings down the street or around the corner. The market can just fade away, or like we will see in 2025, a flood of new inventory can set a new standard for pricing in the neighborhood.
Some days there is enough demand that the best few deals will all sell at once. A surge like that usually happens when there aren’t other distractions like 4-day weekends, Easter, graduations, vacations, etc. We’re due for a wave of demand here over the next 2-3 weeks. But will any of the current homes for sale be considered a good enough deal? it can happen that NONE of the active listings look like deals – especially this time of year when everything is so picked over.
All that a seller has to do is price the home so it is the best deal available, and it will be the next to sell.
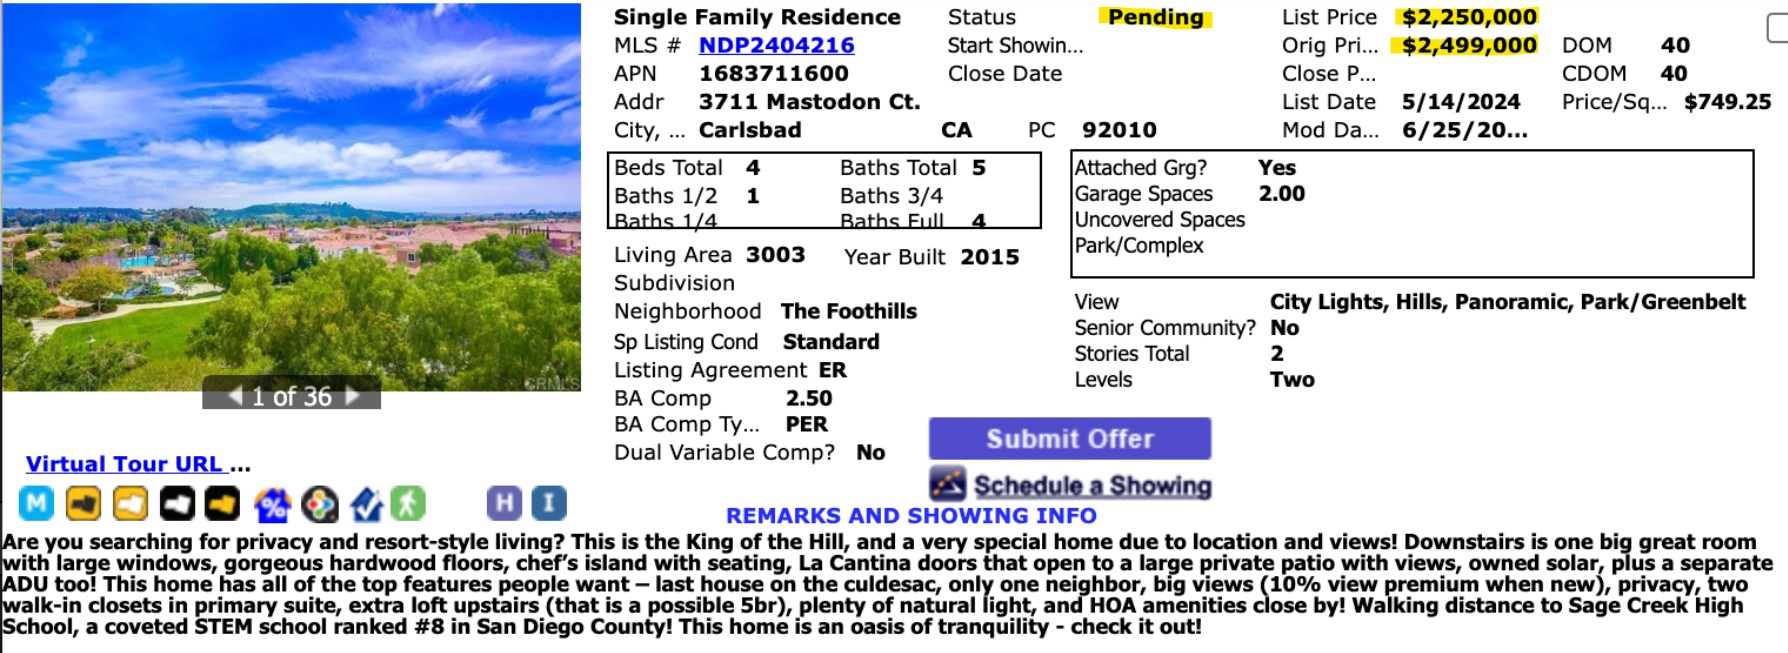
We started with an aspirational price here (my recommended LP was $2,200,000). But we adjusted quickly, and once the price got down to $2,250,000, we found the buyer within two weeks (more on this one later):
San Diego is already an affluent market, and with the extreme weather conditions now affecting the rest of the country year-round, we have to look like a fantastic upgrade to people who just came into some big money. From Leonard Steinberg, the Compass chief evangelist:
Over $82 TRILLION will transfer from older to younger generations in the US over the next twenty years…..that is over $4 trillion of stimulus per year, every year, for the next 20 years!
Over the next 10 years, 1.2 million people worth at least $5 million will transfer an estimated $31 trillion to their heirs and about two-thirds of that extraordinary amount of wealth – or $19.9 trillion – is forecast to be passed on by 2033 by about 155,000 individuals with a net worth of $30 million or more according to research firm Altrata. That is MULTIPLES of the amount of stimulus spent on ALL Americans during COVID that many attribute to spiking inflation…..concentrated in a much, much smaller group, mostly wealthier already.
Yes, luxury market pricing could grow well beyond our imagination.
What might this do to luxury real estate? It’s very possible that we’re about to enter an era of RUNAWAY Luxe-flation. The ability for markets to keep up the supply for this growing demand is almost certain to trigger massive price hikes. That $1,000 per night hotel room that is now $1,750 per night could easily go to $3,000. That $50 million Palm Beach mansion that now sells for $100 million could become a $250 million mansion. Yes, luxury and ultra luxury markets will see massive infusions of capital that may result in lowered buying power per dollar as prices soar.
If this capital infusion is not limited to luxury markets and spreads into other markets that simply cannot afford the higher prices, we may have a problem. Sadly, the pressures for less-wealthy people to squander their money on things that buy them perceived status keeps growing. If builders focus more on more profitable, more expensive properties, everyone else will suffer the consequences too.
This is terrible news – nobody wants to leave! We need volunteers – homeowners, please contact me today in order to pick up your $2 million and be on your way! Greed is good!
The local market got off to a hot start in 2024 (January was hot – something to remember in 2025), so it follows that the selling season could conclude sooner than hoped. Let’s use the data to help decide it.
The NSDCC inventory peak of the year has been in mid-July recently:
July 17, 2023: 430
July 25, 2022: 480
July 19, 2021: 392
When we include the Coming Soons, the number of active listings today is 495 which blows right by the high counts of previous years – and we’re not done yet. The actives will be stacking up for another few weeks before sellers get discouraged and give up on 2024.
How about closed sales? They are the best indicator of all.
NSDCC Monthly Sales
The April sales this year will probably be the high point of 2024. There are 169 pendings today, and 117 of those went pending before June 1st so they have a good chance of closing this month. But adding those to the 44 already closed only gives us 161 sales for June.
It’s ok that the peak has come and gone already for this year.
It just means pricing needs to be sharp – sharper than ever – for the duration!
It’s natural to wonder what is going to happen next.
Today’s hot employment report squashed any hope for lower rates this summer. Home sales are waning. The realtor cartel is a mess. Yet, more listings are hitting the market at all-time high prices without any regard for market conditions.
Home sellers don’t care – they just want their money.
Let’s reflect upon a case we had here at the end of 2022. We know that Carmel Valley has excellent schools and tend to draw the affluent family buyers, which is great for those who can afford $3,000,000+ now.
One of the first neighborhoods built in Pacific Highlands Ranch was a group of what is now considered smaller homes on tiny lots with zero lot lines.
After the mortgage rates took off in 2Q22, the sellers there waited as long as they could – but finally started dumping on price to get out. These are in the order of closing dates – check the first four sales:
When we listed 6065 African Holly, I was determined to stop the bleeding. What good would it do to to list for $1.7 or $1.8 when the last three sales were $1,600,000?
It worked. We got a bidding war started and a cash buyer who was picking up rentals in the neighborhood was the winner, paying $1,660,000.
What’s happened since?
The next four sales sold for about the same, roughly, with three of the four homes taking weeks to find a buyer even though this is PHR entry-level and these are walking distance to Trader’s Joe which has to account for something.
The most interesting fact?
Not one home has listed for sale in the last 12 months!
NO ONE IS MOVING!
The same thing is happening in La Costa Valley, a master-planned community of 1,075 houses built mostly in the late 1990s – and stock full of empty-nesters loaded with equity. In 2024, there have been 12 LCV listings so far, out of 1,075!
I think we could see two things coming down the pike:
As the market slows, fewer people want to sell because they get the idea that the market is ‘bad’.
Estate sales make up most of the inventory.
It would mean that inventory in the newer neighborhoods (less than 30 years old) will dry up like a peach seed, and most of the action will be selling the fixers in the older neighborhoods.
Earlier this year, I speculated that the market could endure – and probably snap up – additional inventory, as compared to last year. The 2023 inventory was like the Mohave Desert!
It seemed that 10% to 15% more would be easily digested, and maybe even +20% or +25%.
Bill’s new stats out today suggest how much, is too much:
None of the pricing metrics are great but at least they demonstrate the trends over time. These graphs above are showing the latest data, including last month, and it’s all fairly positive….for now. With the extra inventory, buyers aren’t going to pay crazy money unless they see the perfect house. Sellers aren’t going to give them away though, so the trend for the rest of 2024 should be flat.
These graphs are interactive so scroll over to see the numbers.
There is extra unsold inventory but nobody is going to call this a flood, especially vs. 2019:
Sales will suffer as long as rates and prices are high. Have we gotten used to having fewer sales yet? The trend is going to last a while – probably for years to come:
Here’s a snapshot of how fast the local market has changed. It went from a relatively-modest suburban area where 3/4s of the houses sold for less than a million dollars in 2003……to a very affluent market!
NSDCC Detached-Homes Annual Sales
True, the inflation rate since 2003 was 70% and a dollar doesn’t buy what it used to back then. But the median sales price went up from $730,000 in 2003 to $2,344,000 this month – an increase of 320%!