by Jim the Realtor | Jul 18, 2024 | Jim's Take on the Market, North County Coastal, Why You Should List With Jim |
The other day I popped off about how the market was deteriorating and we’d be lucky to see 100+ monthly sales the rest of the way in 2024. What do I know? Here is the sales data for this month so far:
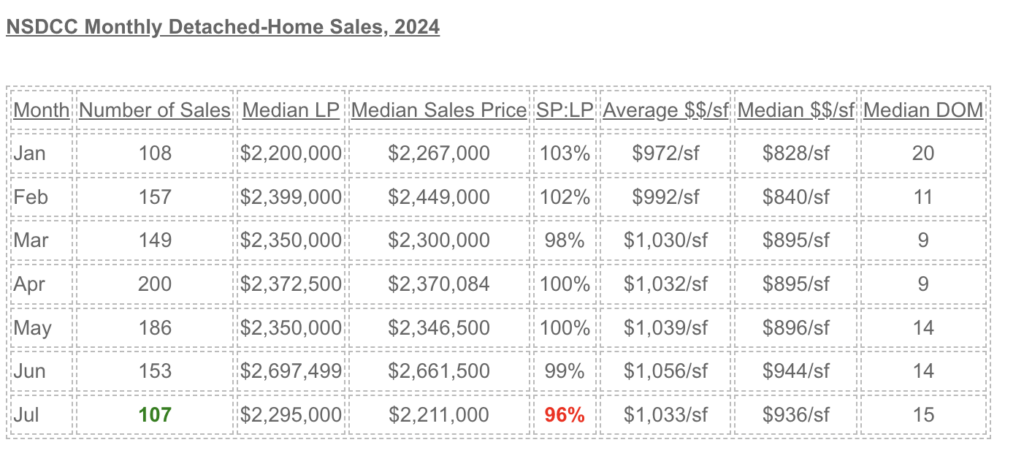
There are two solid weeks left in July – could we get to 200 sales this month?
If so, it will leave the pendings drawer a little light – we’re down to 169 homes in escrow today. But there are 505 actives, and when the coming-soons are included, the count is up to 528 detached-homes for buyers to choose from!
The June median list and sales prices were outliers – the rest of the pricing data looks steady, though the buyers are looking for discounts now – and judging by the 96%, the sellers are obliging!
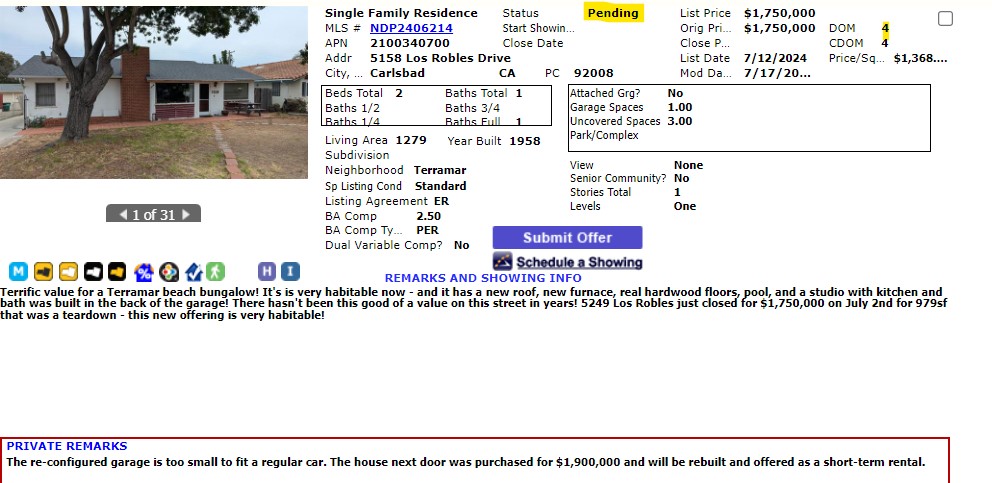
My new listing (below) went over list price though, and I have buyers in a 5-offer bidding war on a different home right now so there is plenty of hot action:
by Jim the Realtor | Jul 5, 2024 | 2024, Jim's Take on the Market, North County Coastal, Sales and Price Check |
Here are four tepid responses to the question on whether home prices will drop this summer:
https://www.cbsnews.com/news/will-home-prices-finally-drop-this-summer-heres-what-experts-say/
The lame last paragraph sums it up:
The bottom line
The real estate market seems unlikely to experience significant price decreases nationally this summer, but it’s possible that in specific local markets, there will be dips. Still, until conditions change, like with more housing inventory, it could be tough for prices to decrease. Even then, it could take time for pent-up demand to temper, but it’s possible that overall affordability at least increases, such as if mortgage rates drop.
~~~~~~~~~~~~~~~~~~~~~~~~~~~~~~~~~~~~~~~~~~~~~~~~`
You can’t come to much of a conclusion about summer pricing in July, but let’s check the data! How we measure the pricing has been strong all year between La Jolla and Carlsbad:
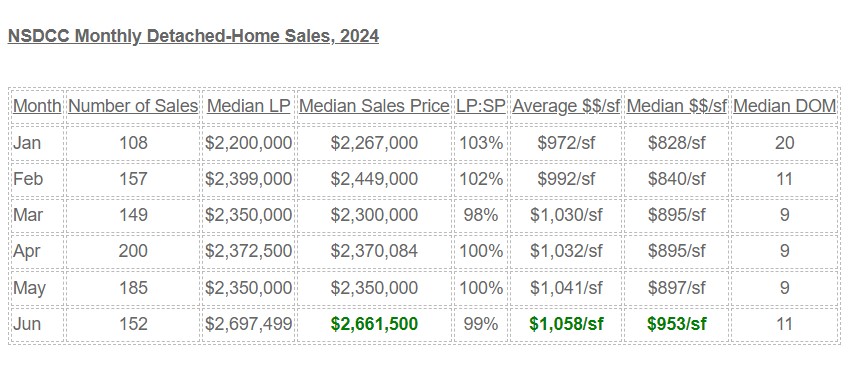
The world is too crazy for something not to give. My opinion of the pricing trend above is that the higher-priced superior homes are gaining in market share (who wants to buy a dump in this environment?) and it’s providing a head-fake that disguises the truth.
What’s going to give is the number of sales – we may not see 152 monthly sales the rest of 2024.
The commission debacle will be discouraging to the marketplace, mortgage rates aren’t going down enough to make a difference, and the political firestorm will get worse. The only way a buyer will ignore all of that and keep buying is if they see the perfect home.
There will be some nice deals for those who are willing to dig them out.
But I think by the screwy ways we measure it, the NSDCC pricing will look fairly strong, but the best precursor of the future – the number of sales – will be dropping the rest of the year, which will create even more softness. Buyers won’t feel confident about the price they are paying unless they have some decent comps to rely on, and those will be few and far between.
by Jim the Realtor | Jun 28, 2024 | Jim's Take on the Market, North County Coastal, Sales and Price Check
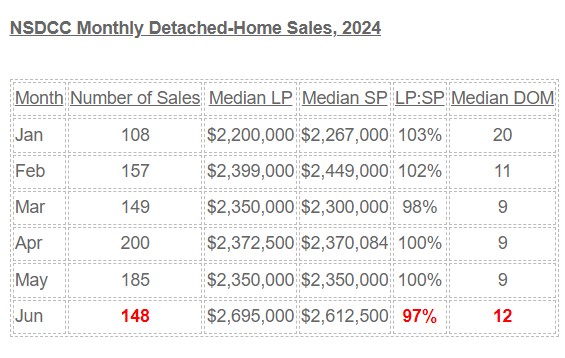
It’s the last business day of June, and while there will be a few more sales added to this total, there will be at least 10% fewer closings than last month:
updated June 30th
The median pricing is higher this month, but I don’t think that means home prices in general are rising. It’s probably because the more desirable properties are the ones selling.
The red numbers suggest the market is slowing down.
by Jim the Realtor | Jun 4, 2024 | 2024, Graphs of Market Indicators, Market Conditions, North County Coastal, Sales and Price Check
None of the pricing metrics are great but at least they demonstrate the trends over time. These graphs above are showing the latest data, including last month, and it’s all fairly positive….for now. With the extra inventory, buyers aren’t going to pay crazy money unless they see the perfect house. Sellers aren’t going to give them away though, so the trend for the rest of 2024 should be flat.
These graphs are interactive so scroll over to see the numbers.
There is extra unsold inventory but nobody is going to call this a flood, especially vs. 2019:
Sales will suffer as long as rates and prices are high. Have we gotten used to having fewer sales yet? The trend is going to last a while – probably for years to come:
Populations from the 2020 Census:
Carlsbad: 114,746
Encinitas: 62,007
Carmel Valley, 92130: 61,595
Rancho Santa Fe: 9,344
by Jim the Realtor | May 24, 2024 | Jim's Take on the Market, Market Conditions, North County Coastal
NSDCC Listings, Jan 1 – May 15

Can we use statistics to describe the market conditions today?
This chart above helps a little. Even though the number of listings is drastically lower than it used to be, apparently the market has been adjusting – mostly by price!
I mentioned that it seemed like everything is priced $200,000 more than it was last year, and the median list price reflects a similar number. Buyers aren’t taking the full plunge though, and the 85% SP:LP is a sign of normalizing (buyers having more negotiating power).
The frenzy that caused virtually everything to sell is long gone, and we’ll probably be back to having 30% to 40% of the listings not selling. This chart doesn’t show the number of refreshed listings where agents cancel and then re-input right away to “refresh” it – but be on the lookout. We will be seeing more of those this year.
Statistically, the market conditions look fairly healthy. Though different than the recent past!
by Jim the Realtor | May 24, 2024 | Jim's Take on the Market, North County Coastal |

Last week, the NSDCC count of active listings was 395. On Monday, it was 429.
Today it is 440, which is a 12% increase since the beginning of May.
Then I looked up the stats from last year. Last May, we had the same +12% increase!
Never mind – keep selling!
by Jim the Realtor | May 17, 2024 | Market Conditions, North County Coastal

How will the rest of 2024 play out?
Like last year, sales will probably fade away unless more sellers are so motivated that they adjust their price in time. The number of NSDCC active listings has stayed under 400 all year – until this week.
Today there are 421 active listings between La Jolla and Carlsbad. Last year the number of actives was only above 400 during a three-week stretch in July.
There have been 90 sales closed in May so far.
by Jim the Realtor | May 15, 2024 | Frenzy Monitor, Jim's Take on the Market, North County Coastal

This chart shows identifies the hot spots, and not-so-hot spots, as compared to last year. Southeast Carlsbad and Carmel Valley both have substantially more pendings this year, and NW Carlsbad and Encinitas have roughly double the number of actives and where potential gluts might be forming.
Overall, there are 25% more active listings, and 21% more pending listings – so much of the additional inventory is getting soaked up.
Pricing is about the same as last year:
NSDCC Median List Price of Active Listings
May 15, 2023: $3,749,400
May 15, 2024: $3,895,000
NSDCC Median Sales Price in May
2023: $2,362,500 (178 sales)
2024: $2,310,000 (68 sales so far)
After last month’s eye-popping 200 sales, there was some hope that this month would be equally productive. But it looks like we’ll be fortunate to match last May’s count.
by Jim the Realtor | May 6, 2024 | North County Coastal, Sales and Price Check
This sales count is tremendous – and there will still be some late-reporters:

The median sales price is back to being higher than the median list price, and it is 10% higher than it was last April – wow!
by Jim the Realtor | May 2, 2024 | North County Coastal, Sales and Price Check
The interactive graphs updated with April stats for the three middle-of-the-road zip codes in San Diego County’s north coastal region. While there was some slumping after rates started rising in May, 2022, pricing has mostly recovered since:
Move your cursor over the graph to see the specific numbers.


