

The reason for breaking down the active and pending listings by zip code is to give the readers a closer look at their neighborhood stats. We have considered a 2:1 ratio of actives-to-pendings to be a healthy market. When there were more pendings than actives, the frenzy was out of control, and when the number of actives reaches a 3:1 ratio of higher, you know that the market is going the other way.
Lately, the ratio has benefitted from cancellations, and today’s A/P ratio is close to the June level:
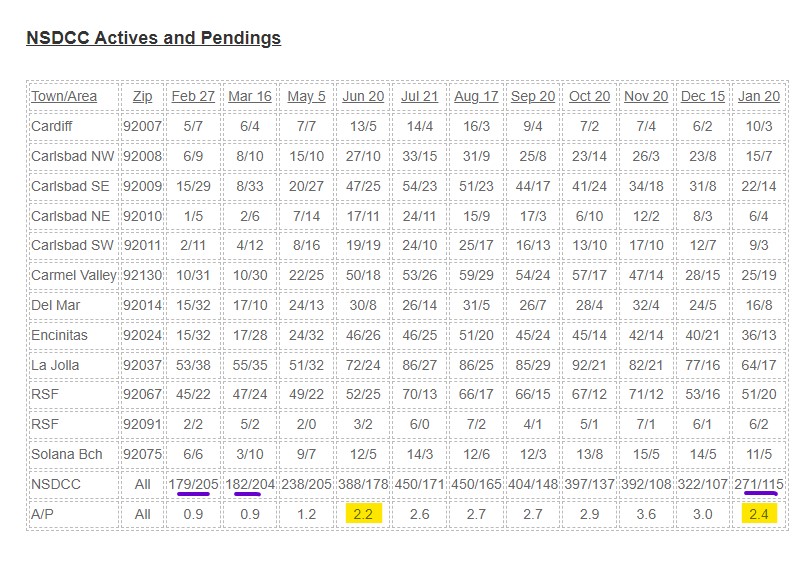
The number of choices today is anemic, and not that much different than the frenzy levels. The combined totals of actives and pendings (underlined in purple above):
Feb: 384
Mar: 386
Jan: 386
Fewer are selling now because of listing exhaustion.
Of the 105 new listings in January:
Number of those on the market in 4Q22, and refreshed as a new listing this month: 44
Number of January listings that were purchased in 2020: 13
Number of January listings that were purchased in 2021 or later: 19
You can say that the inventory of exciting new offerings is extremely tight, especially for those buyers who have been looking since 2020 – you’ve previously seen 72% of the ‘new’ listings.
In 2020, we had 400+ pendings from June 22nd to November 30th – with a peak of 491 pendings on September 7th.


0 Comments