NSDCC Pricing Comeback
Anyone who thought the long slide last year was just the beginning has to be sorely disappointed now.
This is the greatest comeback of all-time!

Anyone who thought the long slide last year was just the beginning has to be sorely disappointed now.
This is the greatest comeback of all-time!
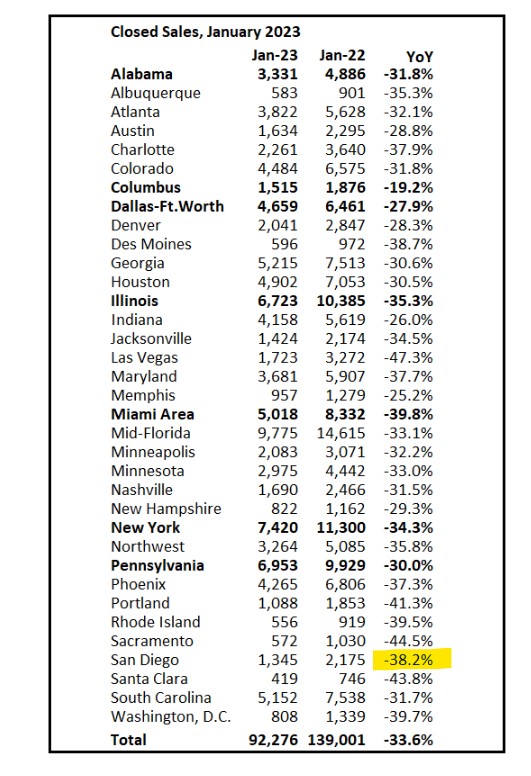
Yesterday we saw how the number of listings has been dropping in San Diego County. Here’s a look at our favorite market – detached-homes between La Jolla-to-Carlsbad:
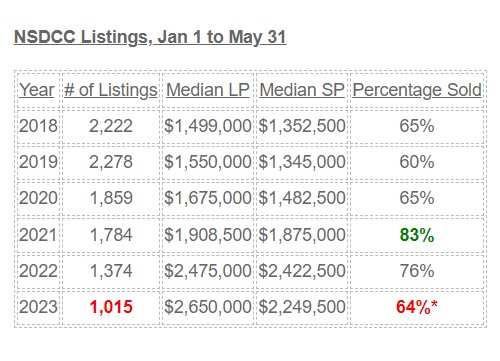
*The 64% is the percentage of 1Q23 listings that have closed escrow – more will be added, but the percentage will probably stay in 60s.
It looks like we’re going back to the good old days when there were big spreads between the median LP and median SP, and about a third of the listings not selling – in spite of having half as many listings!
(this year’s listings count should get up to around 1,100, but still scary low)


The reason for breaking down the active and pending listings by zip code is to give the readers a closer look at their neighborhood stats.
Four areas have MORE pendings than active listings, which is a sign of a red-hot market, and all areas except Rancho Santa Fe are around the healthy 2:1 ratio. But the most interesting datapoint is how the number of active listings has been skidding downward ever since rates went up:
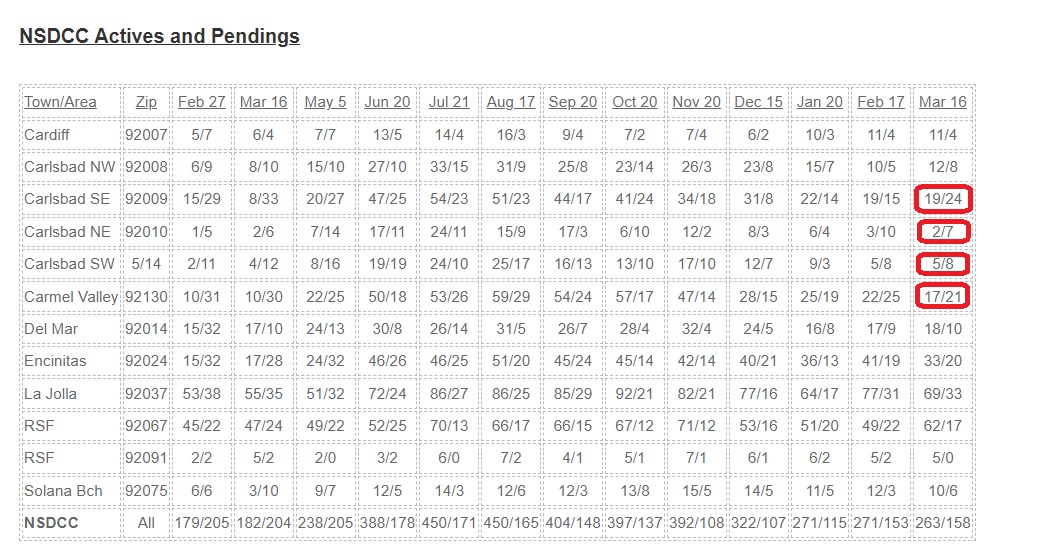
The demand may have dropped off, but the supply is shrinking just as fast, or faster. Virtually everyone who is thinking about selling their house this year is going to be on the market in the next 2-3 months, and so far, it doesn’t look like the number of springtime sellers will be anywhere close to what we’ve had in the past.
The number of 2023 NSDCC listings is already 20% behind last year’s count – which was the lowest ever.
When it comes to anticipating the direction of the real estate market, the median pricing isn’t nearly as informative as these indicators – Number of Sales and SP:LP.
We are used to seeing the sales increase early in the year, but it could have been different if higher rates had broken the market. But it looks like we’re going to survive, especially when you see the SP:LP rising:
NSDCC Monthly Sales
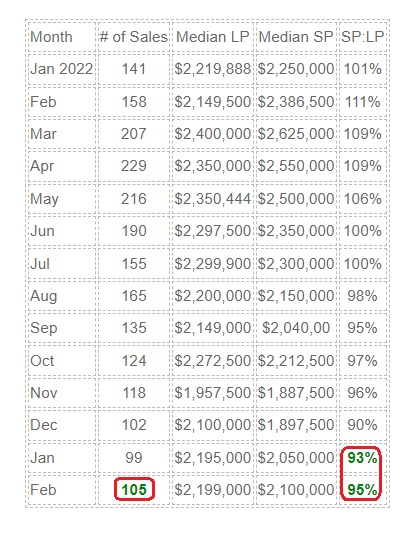
Last February, March, and April were scorching hot, and the market’s about-face in the second half of 2022 looks very orderly, in hindsight. Both the number of sales and SP:LP ratios were declining until recently, and now they make the rest of spring look promising.
Combining the January and February stats gives us the larger sample sizes to better identify the trends.
The sellers are doing a phenomenal job at restricting the supply, and there have been enough buyers to keep the momentum going. The current listings/sales ratio is better than it was in the years before the frenzy, in spite of much higher pricing. Compare today’s pricing to 2021:
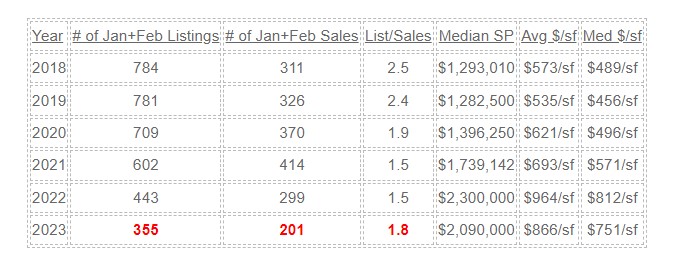
There were 78 of the 201 sales that were all-cash (39%).
It would help if there was more innovation in the mortgage world. You can get a 5-year fixed jumbo at 5.625% today, but with everyone buying their forever home, how many will want short-term money?
Without creative financing or lower rates, we will likely be on a long bumpy road for years to come.
It was the most insane frenzy ever, and it was the most intense at the beginning of last year as inventory started to thin out. Compared to that environment, I think these stats look pretty good:
NSDCC Monthly Sales and Pricing
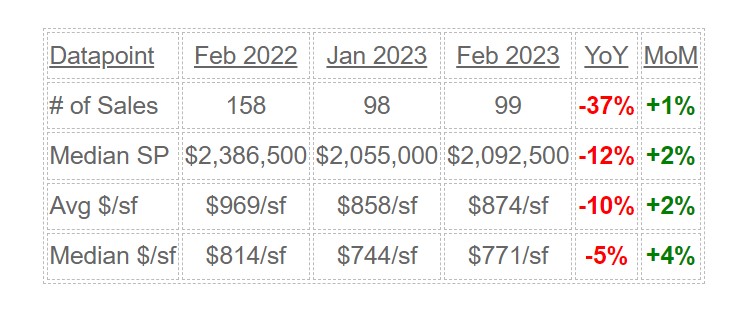
Down 5% to 10% YoY, and on the rise? I’ll take it!
We have an unusual obsession with home pricing – I say unusual because nobody cares that our measuring devices are deeply flawed and regularly give the wrong impression. With the stakes being so high, you’d think homebuyers would investigate thoroughly – but everyone just wants to grab and go!
You can see in the graph above how the smaller sample sizes cause more volatility – Encinitas only had 19 houses sold in December, and ten closings in January – so the 10% to 15% bounces up and down aren’t good representations of the pricing trend.
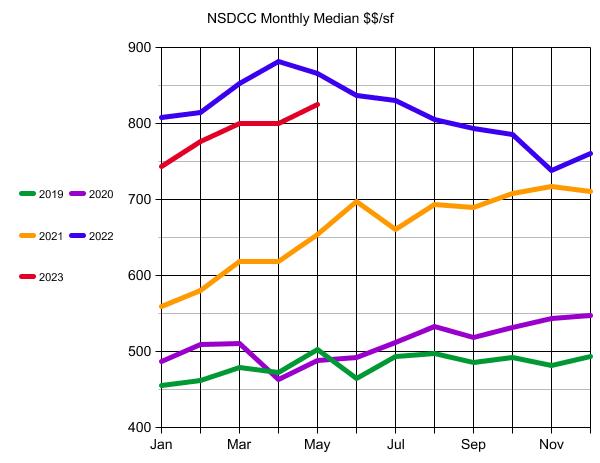
This is a better look at the trend – the average and median $$/sf for houses sold between La Jolla and Carlsbad, and this includes the 70 sales so far this month:
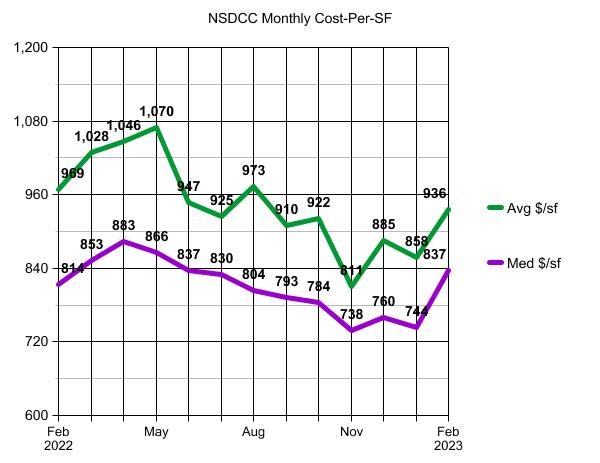
The upward trend should continue as more of the premium products come to market this spring.
I predicted that there wouldn’t be a sale under $2,000,000 in the Davidson Starboard tract in La Costa Oaks after we closed the Plan 2 in October. The first new listing there since is coming soon, priced at $2,899,000 and they should get all the money:
https://www.compass.com/app/listing/7657-sitio-algodon-carlsbad-ca-92009/1253018741329889369
I know they paid $1,999,919 in 2019, but there have been others that have closed for a million dollars over their 2019 purchase price. The Plan 3 layout probably isn’t as popular as the Plan 2, and the backyard is filled with a pool. But this street is a culdesac and it has the best south and west views which only come up occasionally for sale. It’s been so long since we’ve had an offering like this that I wouldn’t be surprised if she has 100+ people look at it next week – in spite of all the doom!
Remember when the inventory tanked in 2020 when everyone was afraid of catching the bug?
Once the pandemic was over, we’d get back to the regular flow of homes for sale, wouldn’t we?
But the intensity seemed to increase as time went on, finally spinning out of control when mortgage rates went up. The resulting debris field is causing fewer people to want, or need, to sell.
For most, staying put seems like the best option, at least for now.
Buyers can probably endure another year on the lease. But potential sellers are getting closer and closer to being too old to move. If there isn’t a clear path to living for another 5-10 years (and hopefully longer) in your new town, you’re probably going to decide to live it out where you are.
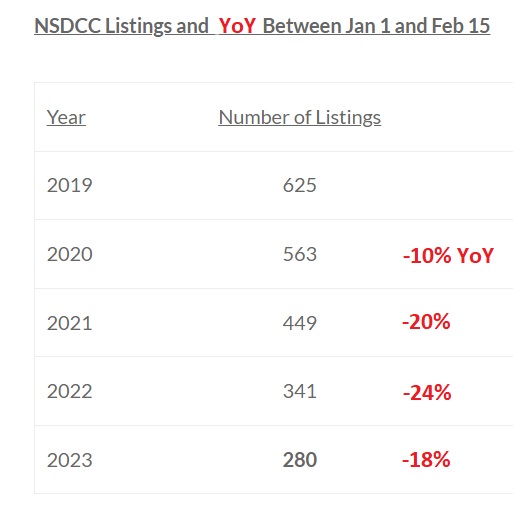
The NSDCC YoY change in January was only -17%, so only half as bad as San Diego in general. But the first 15 days of February are -20% YoY, so the local inventory isn’t exactly getting better.
The drop from 2019 is 55%!
Let’s revisit yesterday’s graph and add the sales to compare the relative health of the market.
If higher mortgage rates were stopping home buyers, then sales would plummet, especially in relation to the number of listings. But if the number of listings plummets too, and we’re down to just the most serious buyers and sellers, we can still have an orderly market:
NSDCC Listings and Sales Between Jan 1 and Feb 15
| Year | |||
| 2019 | |||
| 2020 | |||
| 2021 | |||
| 2022 | |||
| 2023 |
The local market isn’t in shambles or falling apart.
The number of buyers AND sellers are much lower than they were previously, but they are acting in concert and fairly similar to the frenzy years. By the time the late-reporters log in, this year’s L/S will get down to 1.8 or 1.7 which is remarkably similar to the hottest frenzy years of all-time!


Are you looking for an experienced agent to help you buy or sell a home?
Contact Jim the Realtor!
CA DRE #01527365, CA DRE #00873197
