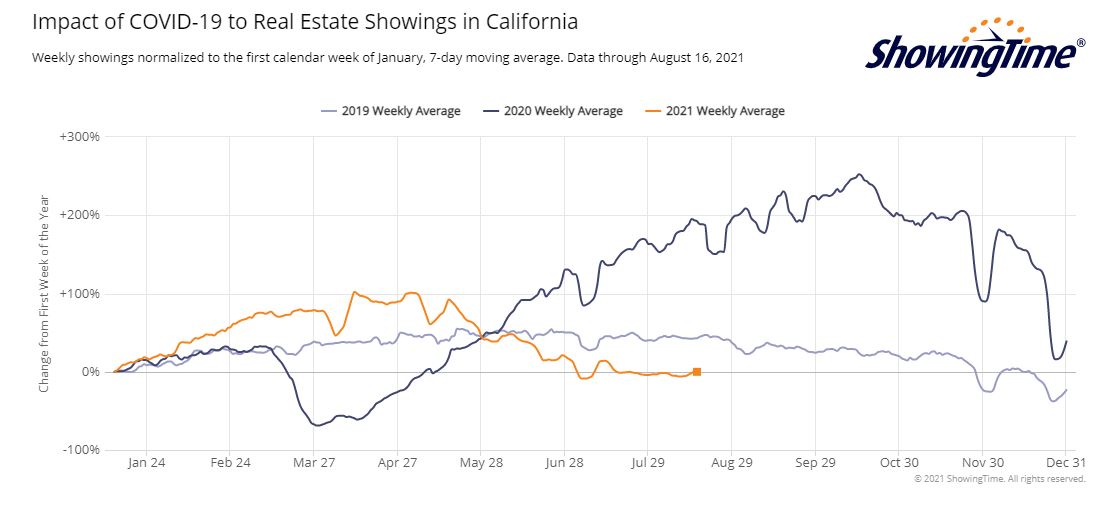
It’s one thing to note that showings are well under the peak frenzy era of August-November. But today’s showings are also well below what they were in July 2019, which was a fairly flat market then.
Is the demand falling apart?
Or is it due to lower inventory?
Let’s compare the inventory counts for middle of August.
NSDCC Number of Homes For Sale
Price Range
August 19, 2019
August 17, 2020
August 16, 2021
$0-$1.0M
103
28
2
$1.0M-$1.5M
179
113
48
$1.5M-$2.0M
199
123
56
$2.0M-$3.0M
543*
137
69
$3.0M+
–
294
200
Totals
1,024
695
375
*In 2019 the highest category was Over-$2,000,000 – the categories were split the next year.
The total counts are distinctly different.
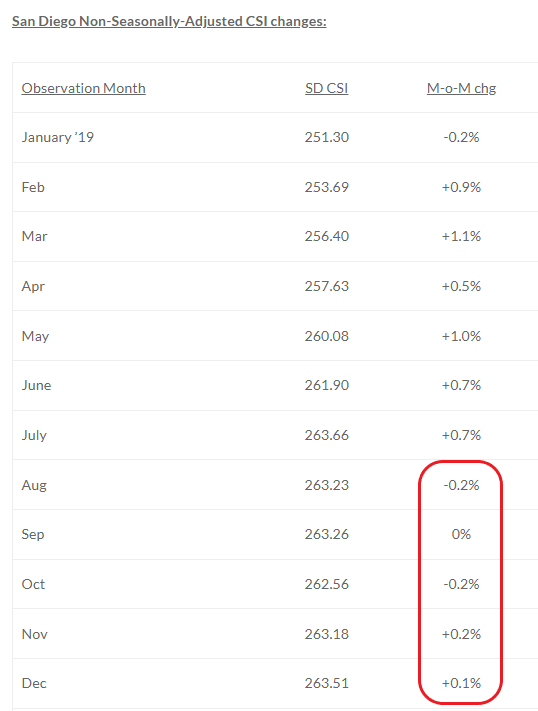
In 2019, the market was sluggish, and the local Case-Shiller went flat for the last six months. There were too many homes for sale.
Last year, the increased demand was met with a much tighter supply than in 2019, but looking back we can say it was the optimal amount of homes for sale in order to create the red-hot frenzy!
Now, there aren’t enough homes for sale to keep the momentum going, and the frenzy is being starved out.
The percentage of buyers who were willing to pay over list reached another all-time high in July:
NSDCC Detached-Home Sales, % Closed Over List Price
January: 38%
February: 43%
March: 53%
April: 55%
May: 54%
June: 59%
July: 64%
There were 33% of the total sales that closed for $100,000+ over list price!
One out of three!
In July, it was the $1,500,000-$2,000,000 range that was red hot, with an incredible 82% paying over list:
Percentage Who Paid Over List Price by Price Range
Price Range
March
April
May
June
July
$0 – $1.0M
76%
79%
89%
88%
89%
$1.0M – $1.5M
68%
78%
84%
75%
74%
$1.5M – $2.0M
66%
66%
72%
66%
82%
$2.0M – $3.0M
54%
32%
34%
66%
56%
$3M+
16%
22%
22%
17%
26%
The average and median prices were slightly lower MoM, but the product mix is different every month. Just having the average and median sales prices being higher than the list prices is remarkable enough:
NSDCC Average and Median Prices
Month
# of Sales
Avg. LP
Avg. SP
Median LP
Median SP
Feb
224
$2,298,797
$2,257,334
$1,719,500
$1,758,000
March
252
$2,295,629
$2,260,524
$1,800,000
$1,825,000
April
357
$2,396,667
$2,403,962
$1,799,900
$1,828,000
May
300
$2,596,992
$2,581,715
$1,900,000
$1,994,500
June
348
$2,509,175
$2,537,953
$1,900,000
$1,967,500
July
311
$2,421,326
$2,442,738
$1,795,000
$1,855,000
July, 2020
351
$1,937,896
$1,863,623
$1,450,000
$1,423,350
Compared to last July, the average sales price was +31%, and the median sales price was +30%!
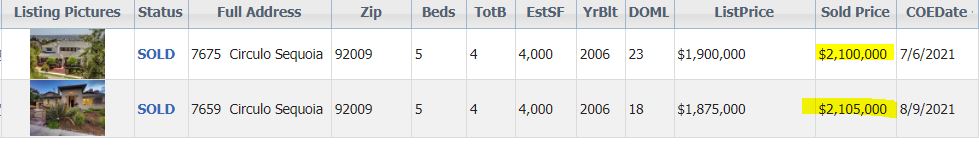
It might feel a little soft in other places, but the newer Davidson homes are always going to be popular.
Here’s an example in La Costa Oaks where two model-match homes sold a month apart and both fetched a similar premium. Here’s how the second one looked:
Buyer fatigue has hit San Diego’s real estate market as some people are taking a break after making offers on several homes to no avail, according to several real estate agents.
“In my opinion, I feel the buyers are feeling beat up and a little tired,” said Dawn Suprenant, with Windermere Homes & Estates. “It’s still crazy. It’s not as crazy as the spring. I think they feel like, ‘I’ve tried everything. I’m going to take a break,’” Suprenant said. “There’s only so many times you can make an offer and be rejected and want to come back.”
Julia Maxwell of Berkshire Hathaway HomeServices California Properties said that for most buyers, “it’s a very frustrating and emotionally draining market.”
“Currently we’re seeing a very subtle, I can’t emphasize how subtle, softening in the upper range prices where we were seeing market times of two days, three days or less, we’re seeing slightly longer market times,” Maxwell said.
Even so, the market remains hot, with multiple offers still commonplace as prices continue to rise, interest rates remain near record lows and buyers far outnumber sellers with no letup seen anytime soon. Suprenant said she recently sold a Rancho Penasquitos home for $101,000 over the asking price. She said it’s become more common for buyers to pay more than list price.
Carlos Gutierrez of eXp Realty of California said the market is shifting ever-so-slightly, but that it remains very much a seller’s market. “We’re starting to see inventory creep up, longer days on market,” Gutierrez said, adding that there are fewer “hyper bidding wars happening.”
“We still have bidding wars but I don’t see them happening as much,” Gutierrez said.
Nancy Layne, president of North San Diego County Realtors, said she’s noticed a letup in the market, like Suprenant, attributing it to buyer fatigue. “We’re finally seeing more stuff come on the market. It’s getting a little more competitive, Layne said. “I think it’s flattening out.”
Dina Brannan, vice president of operations for Century21 Award, said the market “has kind of lost its panic mode.” “Things are not flying off like hotcakes. They’re still going fast, but they’re not this crazy where things are selling before they even hit the market,” Brannan said.
Melissa Goldstein Tucci of Coldwell Banker West said that the overall market is “the strongest it’s ever been,” although she said the number of offers being made on a particular house has dropped a little since mid-June. “The values are still skyrocketing and it’s still a great time to buy because I don’t personally see anything changing anytime soon,” Tucci said. “I see the market remaining strong.”
Wendy Purvey, chief operating officer of Pacific Sotheby’s International Realty, said it would be wrong to say the market was softening. “The frenzy has tailed off. I would not say it has died down. We still have frustrated buyers that can’t get what they want,” Purvey said. “There’s no way that there’s a softening in the market. What’s happening is a tiny correction and that correction is way, way needed in a healthy market. The price and values can’t keep going up at this rate.”
Sean Caddell of Pacific Sotheby’s International Realty, said he’s seen more people paying cash instead of having a mortgage, and they’re willing to pay more than the seller’s asking and they’re eliminating contingencies, “buyer investigations, everything.”
“We’ve had almost every property we sold recently, the buyers have removed their appraisal contingency, whether it’s financed or cash,” Caddell said. “I have not seen it like this before where people are so anxious and excited to get a property.”
According to Reports on Housing, an agency that tracks housing in San Diego and Orange counties, the inventory of homes on the San Diego County market was up by 11% in mid-July, to 3,059 listings but that still was a near record low and compared to 4,577 homes on the market at the same time last year.
The inventory in 2006 – a year before the Great Recession – was 18,000 homes on the market, reaching 20,000 in 2008. Meanwhile, housing prices appreciated at a rate of 14.6%, the highest rate of appreciation since 1988, according to Reports on Housing.
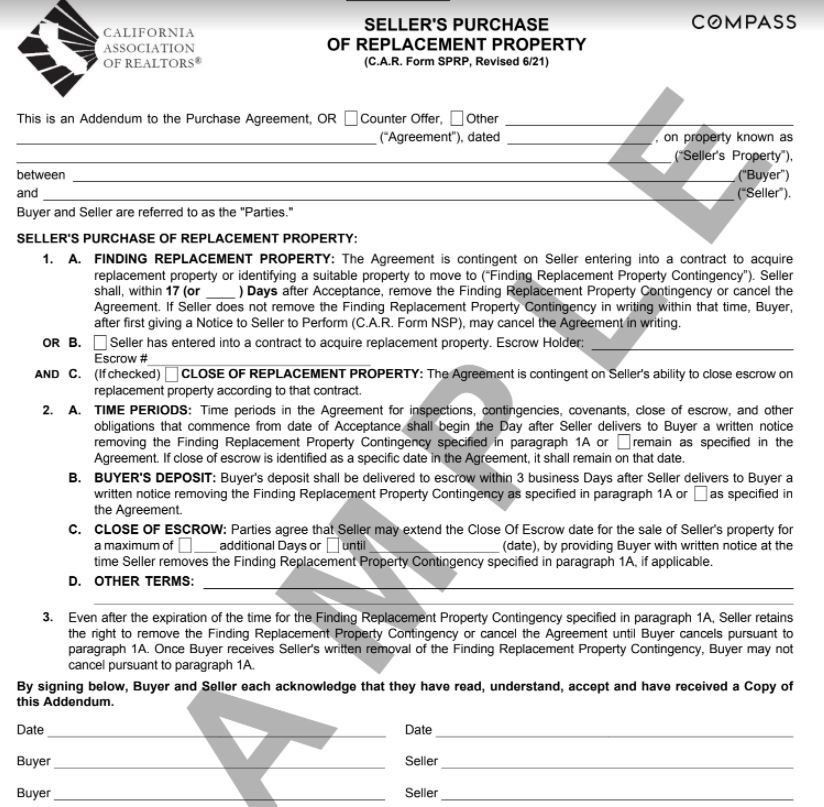
Most want to use the equity in their current home to buy the next one.
But if you sell first and can’t find a replacement, you could end up homeless, and/or having to move twice – once into a (very expensive) rental, and then move again once you finally find the replacement home.
The C.A.R. has revised the form above and it’s a reasonable solution for sellers.
It enables them to put their home on the open market, find a buyer, and come to an agreement to sell the home – with adequate protection that if the sellers can’t find a replacement, they aren’t obligated to sell.
Let’s offer this idea to potential sellers in order to get more listings and increase the inventory. Buyers have had to endure much worse, so if they can tie up a home and just need to be patient while the sellers find a new home, then they should be happy.
We need to expand the possibilities because there will come a day when bidding wars don’t break out on every listing. Without creative solutions, the market could hit a post-frenzy flat spot!
It’s looking more normal every day, though by the time the last sale is recorded, this month’s total should be around 300 sales (though the median SP will say about the same at +29% YoY):
NSDCC (La Jolla to Carlsbad) July Sales
Year
Number of Detached-Home Sales
Median Sales Price
Median DOM
2016
273
$1,100,000
45
2017
260
$1,243,250
19
2018
271
$1,280,000
27
2019
281
$1,300,000
22
2020
351
$1,423,350
17
2021
272
$1,840,000
11
A civilian said to me yesterday, “You just wait until the eviction moratorium is over, and prices start dropping right back down!” Sales would need to drop to zero before the vast majority of sellers will consider making any significant concessions on price. You might see an occasional sale under comps, but there will be a reason – inferior location, bad condition, etc.
Having 130 NSDCC homes in June sell for $100,000+ over list price should be an all-time record. If we had half that many, it would be astonishing!
But those were decisions made in April and May.
It feels like the market is in the deceleration stage, where fewer homes are worthy of a bidding war. Sellers and agents who insist on adding an extra 5% to 10% to their list price will need to be selling an exceptional property AND present it perfectly to generate offers.
The inferior homes/locations (the ones who really benefited during the peak frenzy) will be the ones that feel it the most. The gap between the dogs and the creampuffs will widen.
Listing agents who “have comps”, and around $5, can get a cup of coffee.
Open houses will help with the transparency. Buyers and lookers will be able to experience the upgrades in person, and get a better read on the traffic. The art of determining the difference between lookers and buyers will be renewed.
There will be eye-popping sales.
We will find peace with these higher prices. We would have gotten here eventually – it just happened faster than we ever thought possible.
Higher interest rates won’t have a big impact – there’s too much cash in play to soften the blow. One thing you can count on – sellers won’t care about higher rates. They aren’t in a hurry, they don’t have to sell, and they aren’t going to give it away!
If prices were to come down, it would be slowly and over time. There will be occasional deals that give hope to lower pricing, but then a couple of high sales will happen right behind them.
The ibuyers might be the only candidates who could influence the market in a panic, but they could rent their homes for a while if they had to. They are big corporate entities who are used to losing money, so no real pressure. The old accounting rules REQUIRED banks to sell their properties quickly, but those days are long gone.
More potential sellers will give up the thought of moving, and the number of homes for sale could stay restricted – or even go lower. The hope of there being a post-covid surge of sellers will wane.
If there were an occasional surge of new listings, they would all be priced based on recent sales…..or priced higher. If buyers don’t like today’s prices, having more inventory priced the same won’t help.
The statistics will bounce around more as we pull into Plateau City.
All of the above (except #1) should remind you of how it used to be!
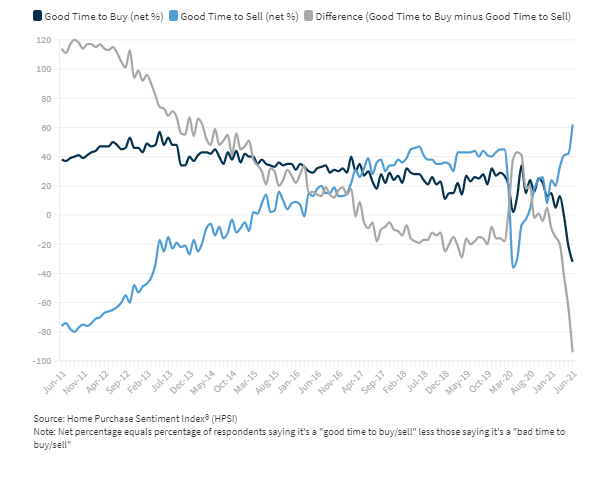
As we roll into the post-frenzy era, we’ll see more national news about the changes – but all we know for sure is that it’s less hot than it was. Note the gray line above.
Fannie Mae said “Consumers are increasingly adamant that it’s a good time to sell, bad time to buy a home” as it released its June Home Purchase Sentiment Index (HPSI). The index, based on the company’s monthly National Housing Survey, shows a growing difference in the number of consumers who hold one or another of those opinions.
The HPSI was largely unchanged in June, dipping from 80.0 in May to 79.7, but questions of whether it is a good time to buy a home or to sell one produced notable results. Only 32 percent of survey respondents said it was a good time to buy, down from 35 percent in May and with an 8 point increase in those who thought it was not.
As a result, the net who were upbeat about buying fell 11 points to -32 percent, 66 points lower than in June 2020. Conversely, the net who said it was a good time to sell rose 20 points in June to 62 percent and was 69 points higher than at the same time last year.
“The HPSI remained flat this month, although its underlying buy and sell components continued to diverge, setting record positive and negative readings, respectively,” said Doug Duncan, Fannie Mae Senior Vice President and Chief Economist. “Consumers also continued to cite high home prices as the predominant reason for their ongoing and significant divergence in sentiment toward homebuying and home-selling conditions. While all surveyed segments have expressed greater negativity toward homebuying over the last few months, renters who say they are planning to buy a home in the next few years have demonstrated an even steeper decline in homebuying sentiment than homeowners. It’s likely that affordability concerns are more greatly affecting those who aspire to be first-time homeowners than other consumer segments who have already established homeownership.”
The percentage of respondents who say home prices will go up in the next 12 months gained one point to 48 percent while the percentage who expect a decline went from 17 percent to 21 percent. There was a 4 point increase in those who expect no change. The net who expected an increase was 27 percent, down 3 points for the month but 18 points higher than last June.
More than half of respondents expect mortgage rates to go up, resulting in a net of -52 percent who expect further declines. This is 8 points lower than May.
Job confidence increased slightly. The number of respondents who said they were concerned about losing their jobs dipped 1 point to 11 percent with a corresponding increase in the share who said they were not. The net who were not concerned rose 2 points to 77 percent.
Duncan continued: “Despite the pessimism in homebuying conditions, we expect demand for housing to persist at an elevated level through the rest of the year. Mortgage rates remain not too far from their historical lows, and consumers are expressing even greater confidence about their household income and job situation compared to this time last year, when the pandemic had shut down wide swaths of the economy.”
The HPSI is up 3.2 percent compared to June 2020.
The National Housing Survey from which the HPSI is constructed, is conducted monthly by telephone among 1,000 consumers, both homeowners and renters. In addition to the six questions that are the framework of the index, respondents are asked questions about the economy, personal finances, attitudes about getting a mortgage, and questions to track attitudinal shifts.