
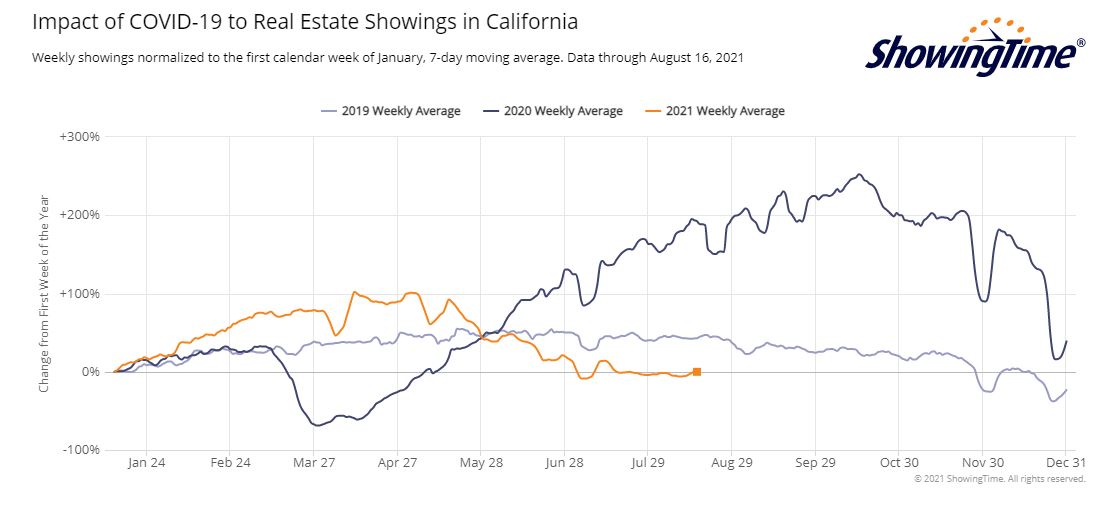
It’s one thing to note that showings are well under the peak frenzy era of August-November. But today’s showings are also well below what they were in July 2019, which was a fairly flat market then.
Is the demand falling apart?
Or is it due to lower inventory?
Let’s compare the inventory counts for middle of August.
NSDCC Number of Homes For Sale
| Price Range | |||
| $0-$1.0M | |||
| $1.0M-$1.5M | |||
| $1.5M-$2.0M | |||
| $2.0M-$3.0M | |||
| $3.0M+ | |||
| Totals |
*In 2019 the highest category was Over-$2,000,000 – the categories were split the next year.
The total counts are distinctly different.
In 2019, the market was sluggish, and the local Case-Shiller went flat for the last six months. There were too many homes for sale.
Last year, the increased demand was met with a much tighter supply than in 2019, but looking back we can say it was the optimal amount of homes for sale in order to create the red-hot frenzy!
Now, there aren’t enough homes for sale to keep the momentum going, and the frenzy is being starved out.


