The Covid Frenzy has had remarkable shift in market efficiency like we have never seen.
Historically, we have had so many listings that 35% to 40% of them didn’t sell.
This year we had 977 listings hit the market in 1Q21, and 80% of them have already closed escrow! Of the remaining listings that haven’t sold, two-thirds of them were cancelled, withdrawn, or expired which usually means that the sellers either changed their mind or refreshed their listings. Of the 977 listings, only 47 of them remain as active (unsold) listings, with a median list price of $6,900,000!
Yet, the extremely active marketplace isn’t causing more people to sell.
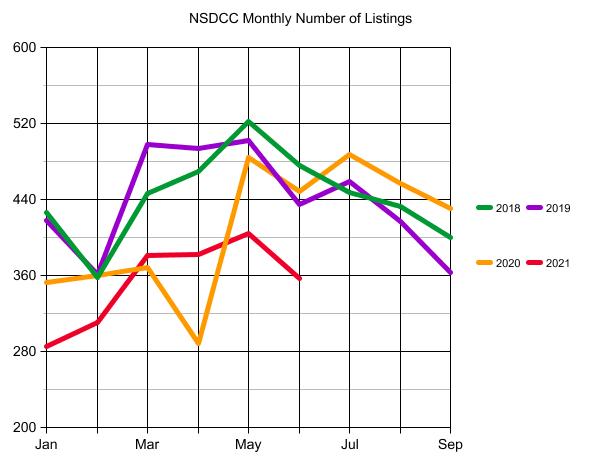
The total number of 2021 listings is 8% behind the covid-impacted 2020!
NSDCC Listings and Sales
Month
2018
2019
2020
2021
2021 L/S
Jan
426/149
418/150
353/182
285/187
1.52
Feb
358/162
361/174
360/184
311/224
1.39
Mar
446/258
498/211
368/206
381/252
1.51
Apr
469/270
494/265
288/156
382/357
1.07
May
522/273
502/297
484/143
404/301
1.34
Jun
476/299
435/282
448/274
357/340
1.05
1H Totals
2,697/1,411
2,708/1,379
2,301/1,145
2,120/1,661
List/Sales
1.91
1.96
2.01
1.28
There were 357 new listings last month, and 340 sales?!?! The lack of inventory or the rapidly-rising prices aren’t slowing down sales! If only there were more houses to sell under $2,000,000!
If sales were to retreat, it would seem obvious that it would be due to the lack of supply. There have been more losers of bidding wars than winners, and that demand has yet to be satisfied.
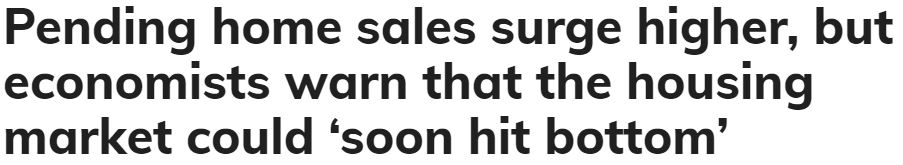
But we are going to hear more doomer talk in the media. Here we have Larry predicting that more homes will be listed in the latter half of 2021 – which would cause MORE sales – yet check the headline:
An excerpt:
What happened: All regions saw an uptick in pending sales, led by a 15.5% surge in the Northeast. The South saw the smallest increase, with a 4.9% uptick.
The big picture: The uptick in pending sales could be sustained, Yun argued, because of the strong stock market and rising home prices. He predicted that more homes will be listed in the latter half of the year, which would help to slow the pace of home-price growth.
Still, economists generally anticipate that the second half of 2021 will see a slowdown in real-estate transactions. To get an idea of where home sales are headed, look no further than the data for mortgage applications.
“Sales lag mortgage applications, and the 26% plunge in the latter between December and April is now working its way through the sales numbers,” Ian Shepherdson, chief economist at Pantheon Macroeconomics, wrote in a research note. He went on to argue that “sales will soon hit bottom, given the flattening in mortgage demand over the past couple months.”
The latest mortgage-applications data from the Mortgage Bankers Association would back up that prediction. The trade group’s index that measures the volume of applications for loans used to purchase homes was down 17% from a year ago as of the week ending June 25, and had declined 6% from the previous week.
Hit bottom? Bottom of what?
The ‘26% plunge’ in mortgage applications between December and April didn’t slow sales – they are higher in every market. But determined to find some doom, he surmises that the lower number of purchase applications will catch up to sales some day?
It doesn’t occur to the ivory-tower types that the market was going ballistic last summer, and this week’s mortgage apps being 17% lower than last year is not alarming. We had 350 NSDCC sales last August, and another 361 sales in September – both record highs!
Yet the media publishes this garbage without a thought. They could unwittingly cause a slowdown just when more homes might be coming to market – which would goose sales higher, not lower.
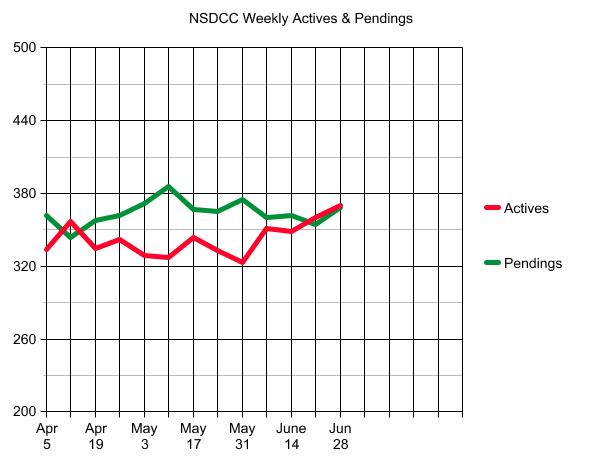
Statistically, the frenzy should continue to be impressive – it’s been red-hot for so long that it could cool off 25% and still be a vibrant marketplace. It will depend on the flow of homes coming to market, which we’ve had an uptick over the last two weeks – and the pendings have surged right with them (see above).
The residential real estate market has no boundaries on pricing.
It’s free enterprise at its finest – no laws, no restrictions, and no limit on where prices can go.
We saw a dramatic example where a model-match tract home on the same street sold for $550,000 more than the last sale the month before!
Many local homeowners can say they’ve picked up another half-million in appreciation in just the last year, which provides one more hurdle to moving.
Their net profit exceeds $500,000, which means they are going to pay capital-gains tax if they move.
Nobody likes to pay tax to Uncle Sam – especially when it might be six-figures!
We’ve seen it with the investment properties, for example. Long-time owners who paid a tenth of the money they can get today who absolutely refuse to sell just because of the taxation. They could still reap hundreds of thousands, or even millions in profit after paying the tax, but it irks them so much to pay the government that kind of money, that they refuse to consider it – and most consider it a shakedown.
It’s the same with residential. If you have to pay the government a big chunk of your profit in taxes, you’re going to think twice. It may even be the last straw, and end up being what prevents you from moving.
The 2-out-of-5 years exemption was created in 1997 and gives married homeowners as much as $500,000 in net profit, tax-free, when they sell their home.
But in 1997, the median home price in America was around $170,000 – and today it is twice as much.
Shouldn’t we revise the rule to reflect the increase?
I think so.
Let’s double the exemption and make it $1,000,000 tax-free.
Politicians would need to agree that the lack of supply is killing the American Dream for the middle class. Without more homes for sale, the pricing will continue to climb until homeownership is beyond the reach of most people – which it already is in many areas.
Last month’s sales didn’t set a record, but they were very strong given the shortage of inventory which was about 25% under the usual number of May listings.
Check the YoY price increases for May:
Median Sales Price: +43%
Average $$/sf: +36%
Median $$/sf: +34%
No matter how you measure it, pricing is through the roof!
The best part about returning to normal is dropping the requirement of having to sign the covid disclosure – known as a ‘pead’ – just to see a house. I don’t mind the paperwork, it’s the badgering by listing agents to submit the form immediately before anything else can happen – like scheduling a showing. I hope we get back to talking about sales!
The California economy will reopen on June 15th and, with limited exceptions, will return to normal operations.
Q1. Will there be any restrictions on open houses or showings?
A1. The only legal restriction will be for wearing masks, otherwise there will be no restrictions. No physical distancing will be required for attendees, guests and customers. No cleaning. No posted rules of entry. And no PEADs or any other type of sign in. No one will have to agree to an office prevention plan. No one will have to attest to their current health status.
Q2. What will the rule be for wearing masks?
A2. The rule is: People must wear a mask indoors unless they are fully vaccinated. This follows the CDPH Guidance for Face Coverings (last updated on June 9, 2021). For fully vaccinated persons, it will make no difference that other unvaccinated persons are present indoors. As long as a person is fully vaccinated, that person need not wear a mask.
Q3. Are there any exceptions from the mask wearing requirements?
A3: Yes. The following individuals are exempt from wearing masks:
Two-year-old children or younger.
Persons with a medical condition, mental health condition, or disability that prevents wearing a mask, or are otherwise unable to remove a mask without assistance. For example, a person for whom wearing a mask could obstruct breathing.
Hearing impaired persons who need to see the whole face for communication or be understood.
Persons whose work exempts them by law.
Q4. My seller wants to require that everyone entering the property wear a mask or be vaccinated. Can the seller require this?
A4. Yes. The seller can set their own rules as to who will be admitted to the property.
The seller can:
Require all visitors to wear a mask.
Require all visitors to be vaccinated or show a negative COVID test.
Implement a vaccine verification to determine whether individuals are required to wear a mask.
Provide information to all visitors regarding vaccination requirements and allow vaccinated individual to self-attest that they are in compliance prior to entry.
If your seller would like these rules implemented, you will need the seller’s consent. Your office may require that the listing be formally amended. You may add optional language such as, “with the exception of _____________________________________ .” or “The following showing requirements shall be followed: ______________________________________.”
On a separate note, if the Listing Agreement Coronavirus Addendum or Amendment (C.A.R. Form RLA-CAA) has already been signed, you may want to now add a Modification of Terms by writing the following into the Other paragraph: “The RLA-CAA, dated ________, is terminated.”
Q5. What is the practical advice for a seller and/or a broker regarding mask wearing requirements?
A5. The practical advice is to adopt a policy that requires everyone to wear a mask. It’s true that a fully vaccinated person after June 14 need not wear a mask, but then that puts the agent in the position of having to ask everyone about their vaccination status. Rather than do that, wouldn’t it be simpler and easier just to adopt a blanket rule that everyone visiting a property wear a mask? Discuss your approach with the seller to obtain the seller’s agreement.
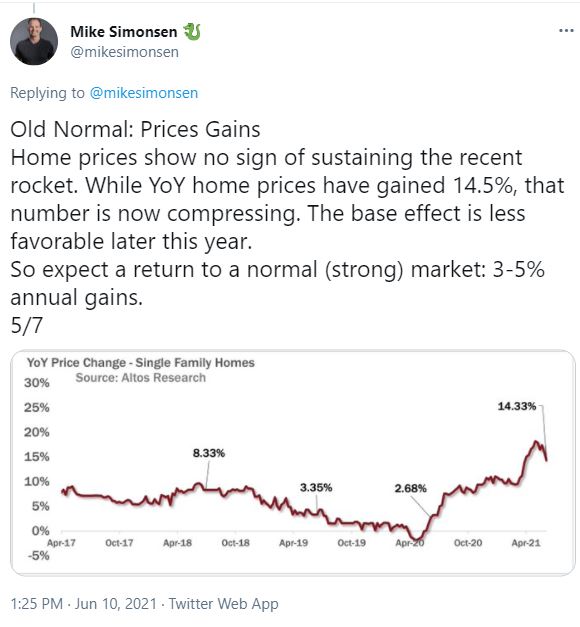
Mike thinks this year’s price explosion was unusual, and is working its way back to a more-normal pace. I agree with Mike, and think the market will split, with those products that have been the hottest (one-story homes, family homes with yards and pools, etc.) will stay red hot, while those on the fringes (inferior locations, condition, age, etc.) will struggle to keep up and their appreciation rate will flatten faster.
Here is his Twitter thread, and webinar – thanks Mike!
Based on these closed sales, the local frenzy has been steady this year – though these are results of buying decisions made as far back as January and February.
For the most part, we have as many or more sales, and the same or higher LP:SP ratios over the last 60 days compared to the sales in the 60 days prior to April 23rd:
Detached-Home Sales By Zip Code
Town/Area
Zip Code
Sales 60 days Prior to April 23
LP:SP Ratio
Last 60 Days
LP:SP Ratio
Carlsbad NW
92008
40
103%
32
104%
Carlsbad SE
92009
95
105%
118
106%
Carlsbad NE
92010
15
105%
22
106%
Carlsbad SW
92011
29
103%
29
106%
Encinitas
92024
87
103%
92
104%
Carmel Valley
92130
72
101%
88
101%
This shows that the frenzy trends have been fairly consistent so far this year. Tomorrow we’ll take another look at the active and pending counts to see if there is any drop-off in the works.
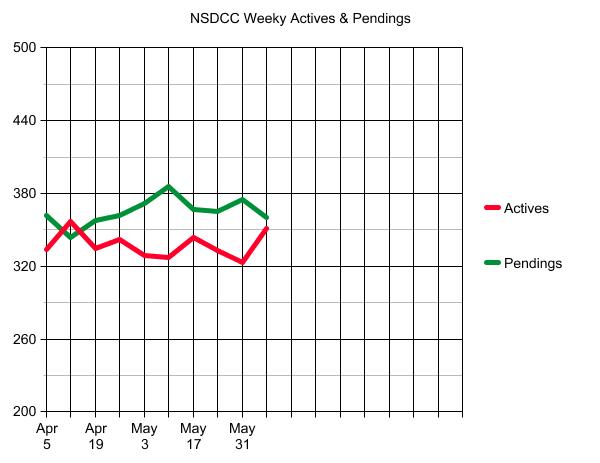
It is extremely unusual to have more pending listings than actives – I can’t remember a time when it has ever happened before, and certainly not at these record prices.
You can tell your grandkids that you remember when!
This week, we did have the lowest number of new pendings since January, and if these two lines cross again and and we go back to 1:1 or even 1.5:1, it won’t be panic time! A ratio of 2:1 is ‘normal’.
Today’s median list price for the active listings is $3,795,000, and for the pendings it’s $1,950,000.
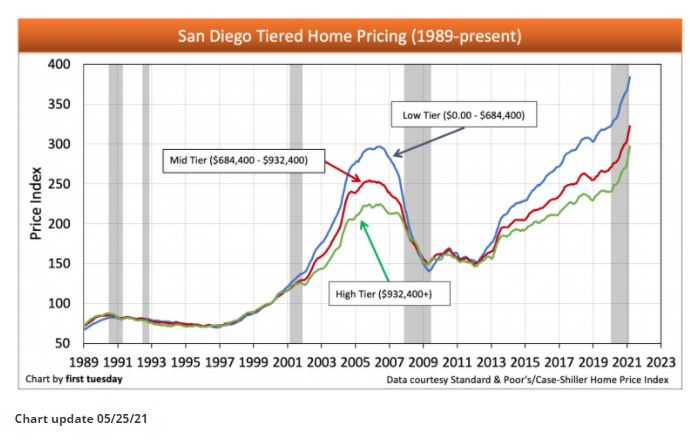
This graph is charting the local Case-Shiller Index. The latest reading is from March, so these trends are reflecting the first quarter of 2021 – which means these lines will be going straight up for at least another 2-3 readings before there is any chance of a change.
The editors expect a collapse in prices next year, though they are coming to the wrong conclusions:
The 2003-2007 era was goosed by increasingly-easier financing each year, so using those years as a gauge wouldn’t be accurate (financing has never been so tough to get now).
But the 2013 frenzy lasted for about a year – as long as we’ve been on fire now.
Are we due for a cooling off? Today, there are listings on the fringes that aren’t selling as fast, or at all.
But the red-hot newer tract homes with decent yards and pools will continue to attract a crowd, as will the single-story homes – probably straight through the 2022 selling season.