While we’re talking about the median sales price of detached-homes in San Diego County, let’s review the last ten years. There usually is some dropoff towards the end of the year:
The last frenzy in 2013 saw the median sales price increase 26% between January and September.
The Greatest Frenzy of All-Time started with closings in May, 2020 that had a median sales price of $660,000. It peaked in June/July at $875,000, which is a 33% increase and lasted five more months than in 2013. I’m happy with it, the fun was great while it lasted, and now here we are.
Well, at least until 2022.
There was some hesitancy in the market at the end of 2013, but it took off again in 2014.
Look at the difference though (the graph is interactive).
The increase was only +7% between September, 2013 and June, 2014 before it decelerated again – and the median sales price in November was back to where it was in the previous September!
Sellers should appreciate the big boost we’ve had, and the uncertainty of the future. Don’t attempt to time the market for max return – it’s great where it is today.
One factor that will slow down the exodus is the increased difficulty of moving out of state – it’s not easy, or cheap, to buy a home outside of California any more. But fewer people leaving will mean less inventory – and could ramp up the frenzy in 2022.
The researchers used open-source data from Zillow or other providers to score the top 100 overvalued or undervalued metro areas in the nation, ranking the cities by a percent premium homebuyers are paying in today’s market based on a history of past pricing.
Here’s how the top 10 rankings landed, according to the research:
Boise, Idaho, where homes are selling at an 80.6% premium.
Austin, Texas, at a 50.7% premium.
Ogden, at a 49.7% premium.
Provo, at a 46.2% premium.
Detroit, at a 45.6% premium.
Spokane, Washington, at a 45.2% premium.
Salt Lake City, Utah, at a 42.4% premium.
Phoenix at a 42.3% premium.
Las Vegas at a 41.9% premium.
Stockton, California, at a 38.5% premium.
The typical value of homes in Boise was over $523,300 as of the end of August, up more than 46% over the past year, according to Zillow.
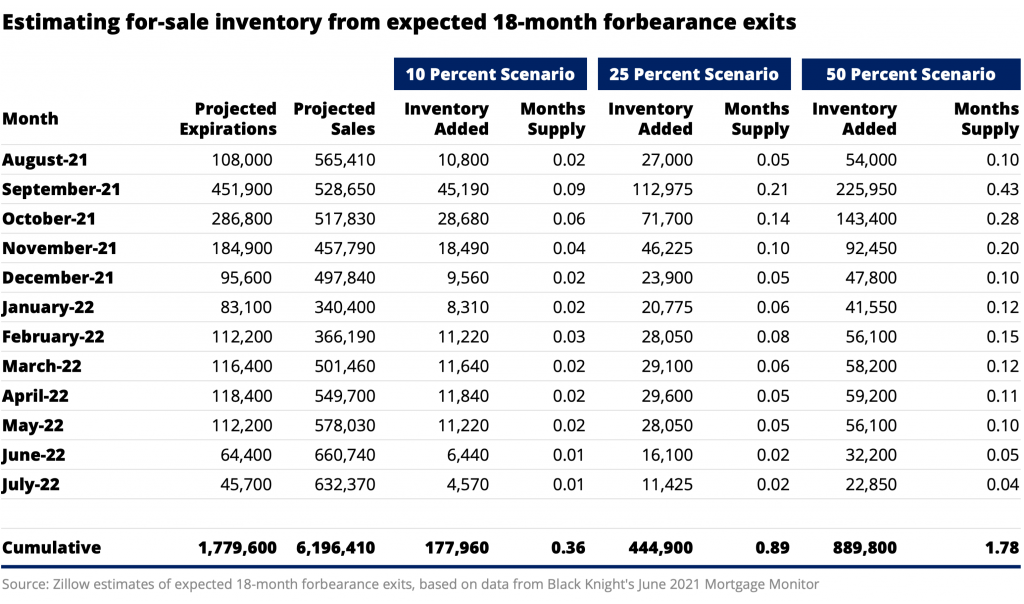
With expiration of a broad federal foreclosure moratorium on July 31, hundreds of thousands of U.S. homeowners are expected to exit forbearance in coming months. A significant share of these homeowners will likely end up listing their home for sale, contributing meaningfully to overall inventory levels and allowing homeowners in forbearance to benefit from home price appreciation and use the equity gained for a future down payment, according to a Zillow analysis.
Unlike 2008, when financial conditions and a souring housing market pushed many homeowners into involuntary foreclosure, strong equity growth and a robust sellers market are likely to ensure that even distressed homeowners have more options and the housing market is likely to be insulated from widespread disruption.
The largest wave of forbearance exits is expected in September and October of 2021, and Zillow projects that forbearance exits will lead to an additional 0.40 months of housing supply in August – October of 2021, a 15% increase relative to 2.6 months of supply in June. For context, this additional 0.40 months of supply roughly means an extra 211,700 homes for sale, which would represent 13.1% of all predicted sales over the next three months.
I hope those in forbearance do list their home for sale – call me today!
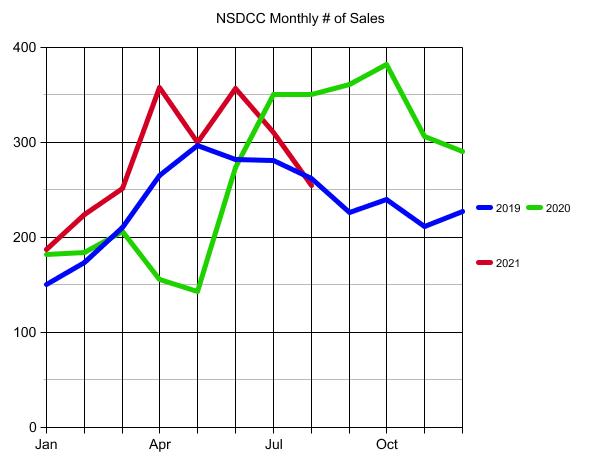
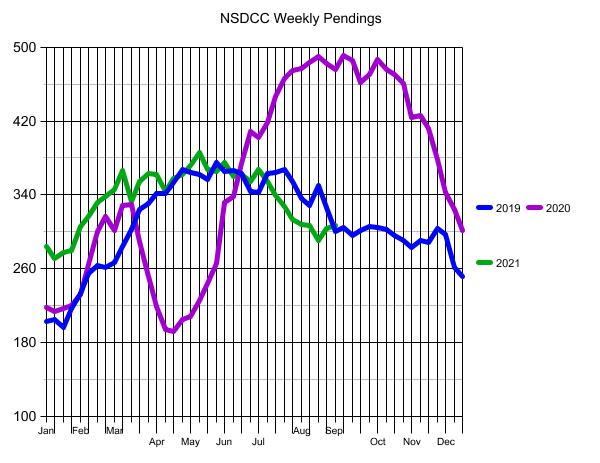
The NSDCC market is starved for inventory – look at the differences:
September 14, 2020:
654 active listings
481 pending listings
September 13, 2021:
316 active listings
304 pending listings
Last year we had more than twice the number of active listings as we have today! We can handle more!
But the foreclosure laws in California were significantly modified and nobody is going to get foreclosed – so don’t wait around for that to happen. The most likely scenario is for the lenders to continue the free-rent program for another year or two, and only lightly suggest a potential sale to those not paying their mortgage – which will only sprinkle an occasional new listing upon us.
School is back in session and the holidays are right around the corner – it’s the time of year that potential home sellers start looking forward to the next selling season, instead of moving in September/October.
Are you thinking of waiting until 2022? Here are my reasons for selling now, instead of later:
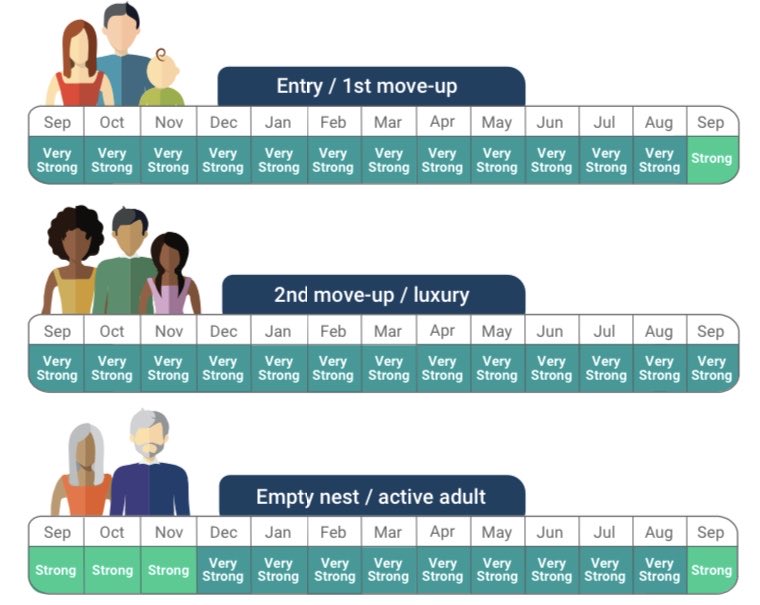
1. The Shine Is Off The Frenzy. Those who are pulling back on their enthusiasm:
JBREC – Two of three buyer categories are down slightly (above chart).
CoreLogic – they only predicted a gain of +9.1% in San Diego pricing over next 12 months, which is way less than the +23.7% since last July. Don’t be surprised if +9% becomes the new +3% of predictions – it’s a lot higher than the previous safe bets without being double-digit.
Zillow Offers – backtracking 5% on price commitments made 2-3 weeks ago.
Navy Fed – suspended the issuing of home-equity loans ‘temporarily’.
Refi appraisals – heard of several appraisals coming in low as market softness creeps into their minds.
2. Interest rates – They have nowhere to go but up, and it’s just a matter of when. Once they start, home buyers will want something in return from sellers.
3. Boomer liquidations – There probably won’t be a mass exodus, but all you need is 2-3 on your street.
4. Fewer Fix-Ups – The current inventory is so thin, sellers are getting away with murder now. If there was an index that measured how close sellers got to selling ‘as-is’, we’d be setting records today.
5. Safe – You know what you can get today, and let’s admit – it’s a lot higher than it used to be. Cashing out now instead of risking any of the above getting worse in 2022 is the safe bet. How much are you hoping to hold out for next year? Another 2% or 3%?
When is the best time to sell? When everyone else isn’t!
Kim Rohrer was looking forward to leaving the leaky windows in the two-bedroom Berkeley rental duplex that she shared with her husband and two small children.
The couple recently found a three-bedroom, two-bathroom chalet-style house in Berkeley listed for $799,000, which seemed relatively affordable for the area.
The house needed significant work, including plumbing upgrades, but the couple wasn’t deterred. “It was like a dream house,” said Ms. Rohrer, who works in human resources for a tech company. (Her husband works at the University of California, Berkeley.)
The couple offered well above the asking price: $850,000. They knew there would likely be multiple offers but they also needed to save some money for the necessary repairs. They didn’t get the house.
They didn’t even come close. The home sold for $1.4 million — nearly double its asking price. “It’s terrible,” she says of her house hunting experience so far. “Completely terrible.”
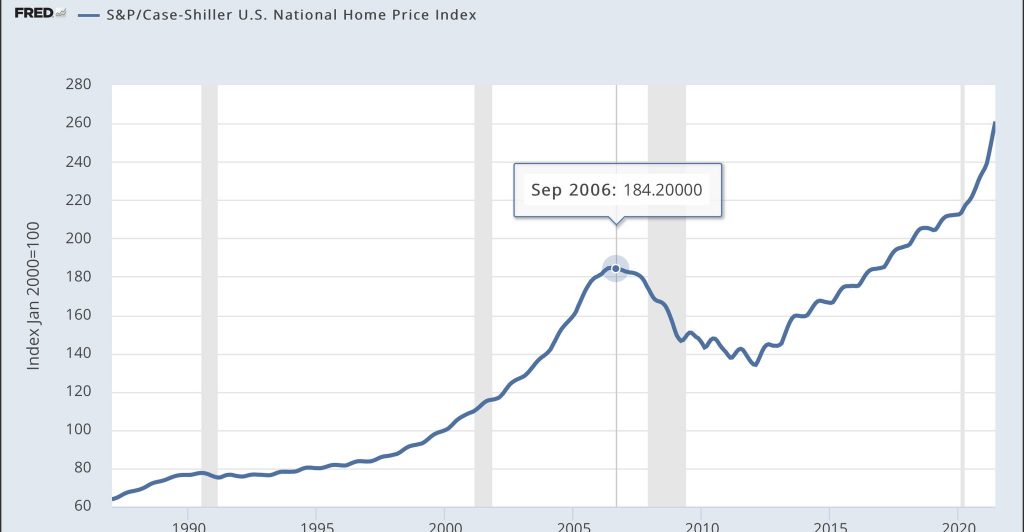
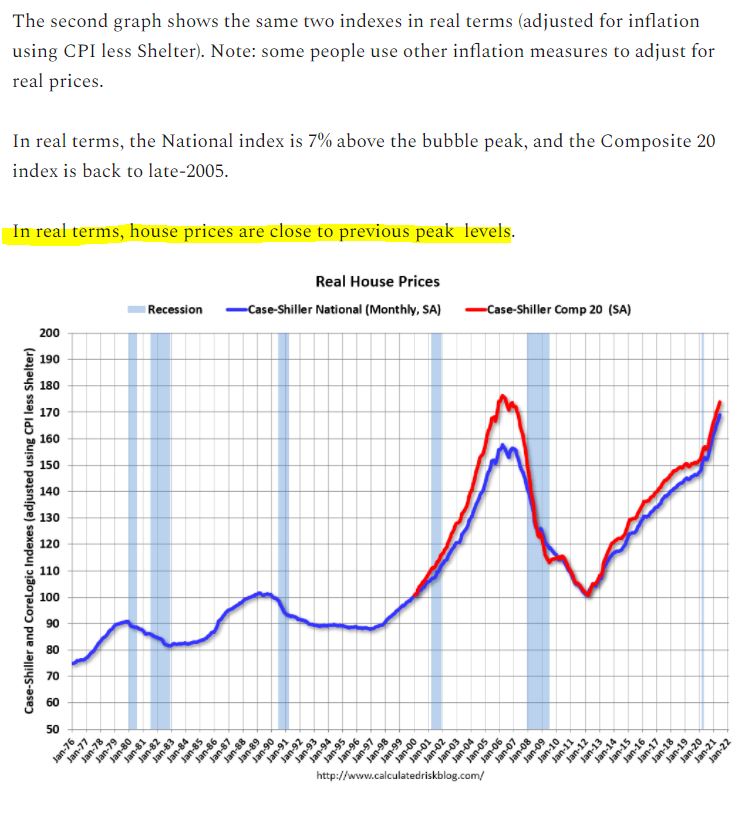
You could say that home prices have only been tracking inflation over the last 10-12 years.
Has the frenzy over the last 12 months just added the annual 2% to 3% increase to home pricing that we’ve always assumed over the last decade, but didn’t realize due to inflation? Could be!
Our local home prices have been rapidly escalating over the last year. First, we ran out of NSDCC houses for sale under $1,000,000, and today there are only 6 for sale priced under $1,100,000!
What are the alternatives for those buyers who want to spend less?
Buy a house further out.
Buy a condo/townhouse.
Get bigger gift from parents or grandparents.
Keep playing the lottery!
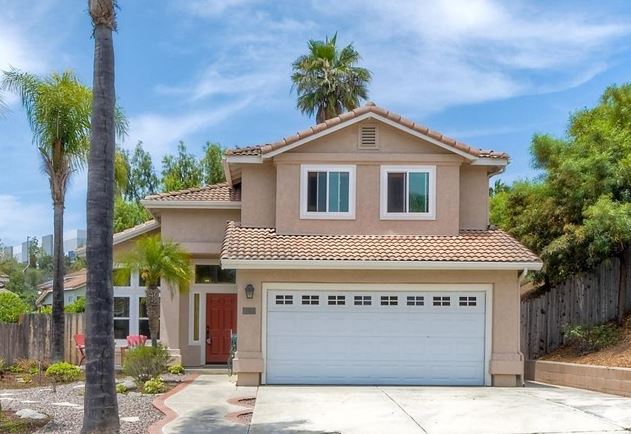
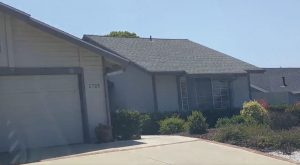
Here’s an example of going just a tad further out. This house is located on the border of Carlsbad, and while it did have ten offers and got bid up $80,000 over list, it closed for $830,000:
This is a repeat of the 2br house featured on my tour a few weeks ago, with the resulting sales price.
The agent admitted they priced this 2br house low on purpose to attract a crowd, and it worked. The list price was $699,000, and it sold for $1,100,000 cash. Meanwhile, the two other listings around the corner priced at $1,149,000 and $1,200,000 are still unsold.
Sellers are resistant to price attractively, but look how well it works when you Get Good Help!
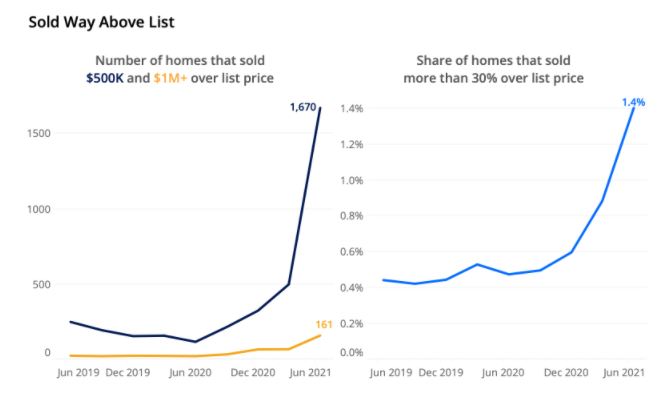
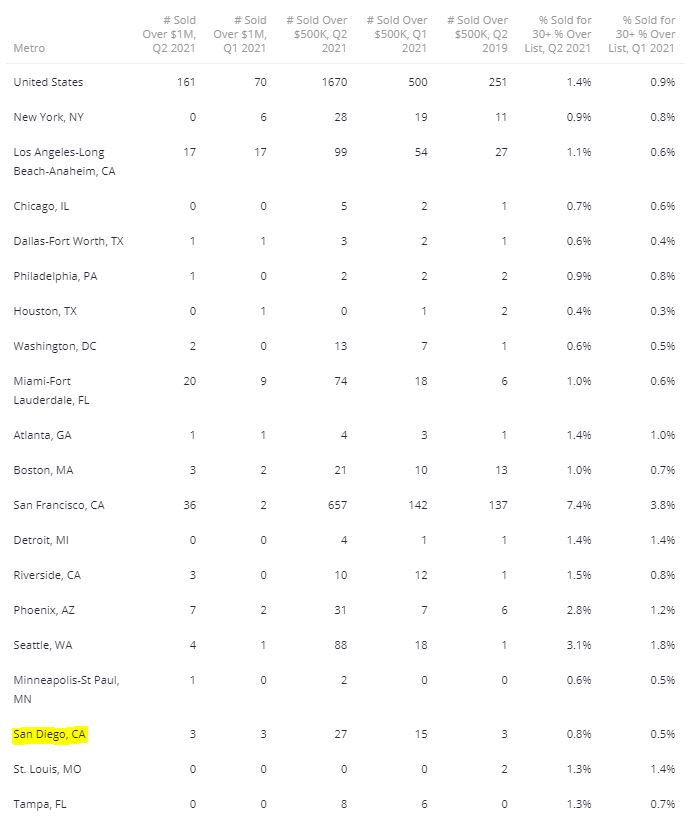
San Francisco leads the 50 largest U.S. metros in the share of homes sold for 30% over their list price or higher at 7.4%. It’s followed by the hot market of Buffalo, NY, where 6.2% of homes sold for more than 30% over list, and Austin (5.3%). All shares in these markets are up substantially over the first quarter.
The markets with the most homes sold for half a million or more over asking in the second quarter are San Francisco (657), San Jose (283), Los Angeles (99), Seattle (88) and Miami (74).
Can we find the six that sold for $1,000,000 over list? I went looking for that needle in a haystack, but couldn’t find any. If you know of the properties that for more than a million dollars over list this year, let us know! The 2021 numbers are staggering, given the pricing:
San Diego County First-Half Sales, All Property Types
Year
Total Sales
Median SP
Median DOM
Sales Over $3,000,000
2017
19,236
$521,000
22
150
2018
17,922
$554,000
14
156
2019
16,981
$569,000
20
159
2020
15,037
$593,000
14
155
2021
20,263
$702,000
9
485
Record pricing, and record sales at the same time – what a frenzy!