The critical point in this video is when the second seller dropped 7% to make the sale after just three weeks on the market……even though that was 10% under the last sale that backed to power lines.
This is what can happen. Did they have bills to pay? Did the agent press them to take it? We don’t know, yet we consider every comparable sale equally and base our opinions on price alone.
The seller of the $2,225,000 sale had purchased it in 2013 for $1,109,000 and his mortgage amount was under $300,000. What’s a hundred thousand in either direction to him?
The previous high sale of this model was $2,100,000 in December, 2021.
The high sale before that was $1,750,000 in 2020.
The high sale before that was $1,320,000 in 2019.
Are we binary simpletons? Will the next seller and listing agent consider all of these variables? Or just go with $2,200,000 as the latest sale/current value and hope for the best? Or check the zestimate?? 😆
The next sale could go 10% to 20% in either direction, depending on the agent.
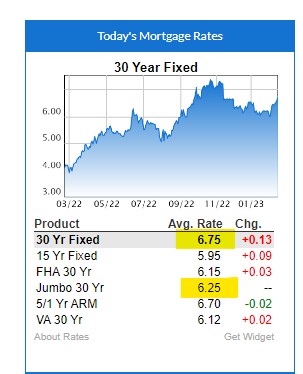
The mortgage rates are heading for 7% again, which is shocking, given it was 5.99% on Feb. 2nd.
Higher rates will discourage both buyers and sellers, and make them want to wait for a “better market” some day in the future. Whether that day will come isn’t considered – all they know is that it isn’t today.
It should mean that the market will be cleared of any casualness, and only the highly motivated buyers and sellers will be engaging. Buyers will be more picky, and sellers will need to be sharp on price.
How sharp?
It will be different in each neighborhood, but I’ll give you one example.
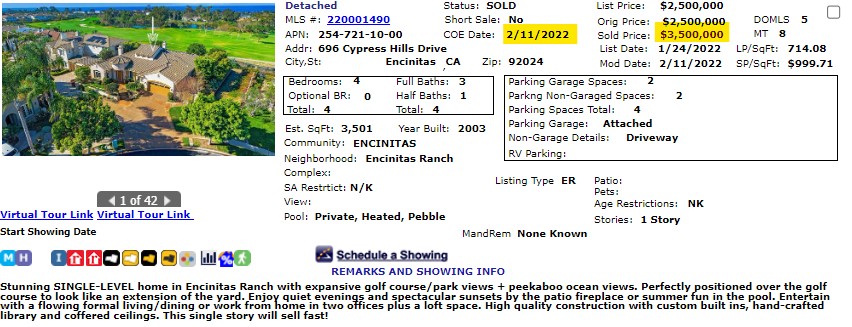
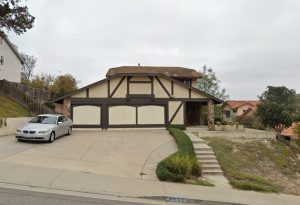
After I set the market on fire in Encinitas Ranch at the end of 2021, this one-story house went for sale. It got bid up a million over the list price (which was deliberately set low by the seller), and the buyer paid cash:
I think the buyer passed away, unfortunately, and the house is coming back on the market.
Today’s list price, just a year after purchase? $2,900,000.
It is possible that 2023 is going to be as good as it gets for sellers – at least for the next few years. The Fed is adamant about crushing the economy, and we could see mortgage rates well into the 7s and, dare I say, we might be pushing 8% mortgages by summer.
The number of sales will be lower than ever, which means more volatility. It will be wild and crazy for some, and that might be entertaining for the casual participants but it won’t draw them off the sidelines.
The higher the mortgage rates go, the less volume there will be and some markets could freeze up.
And this could be as good as it gets for a while – yippee!
I knew every word to every song on this album by the time I was 15 years old – no wonder it’s like this! The song starts at the 3:30-minute mark, but Frank’s pre-song banter is worth it.
I dedicate this to my boss Steve who is in the process of moving to Whitefish, Montana as we speak.
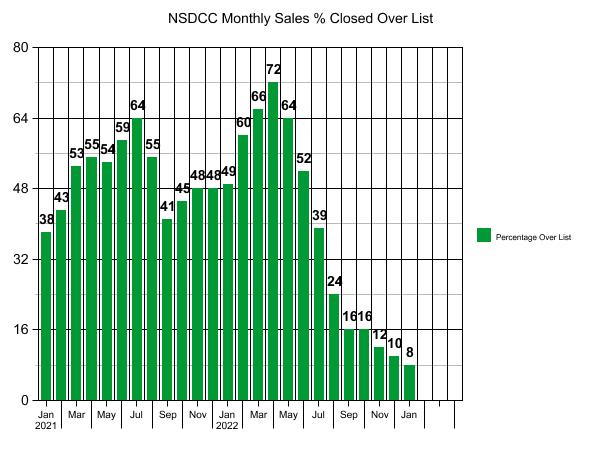
Paying over the list price wasn’t a new thing created by the frenzy – there have always been over-list sales in the past. But getting down to 8% last month begged for a comparison to a previous January!
In January, 2019 there were 151 NSDCC sales, and 18 of them (12%) closed over the list price. Of the eighteen, seven were among the 37 sales that closed under $1,000,000 (which were a quarter of all sales).
Thirty of the 37 sales under $1,000,000 closed for less than full price?
Last month, we didn’t even have ANY sales that closed under a million!
With 92% of closings last month selling for list price or less, it must mean that today’s sellers are more willing to ‘give away’ their home. They have gained huge gobs of equity in the last couple of years, and only the seriously-motivated sellers would dare try to sell their house in a ‘bad’ market. If they need to give back a bigger portion to make the deal, they might do it.
Let’s predict the next few months.
Sellers will still try to get full retail, and based on the over-list stats from last month, 10% or less will get it. The rest will be priced to sit, and after 30+ days on the market, be prone to receiving lowball offers.
This is where the 2023 Spring Selling Season will be made. Will 80% to 90% of sellers take a low offer?
~~~~~~~~~~~~~~~~~~~~~~~~~~~~~~~~~~~~~~~~~~~~~~~
NSDCC Average and Median Prices by Month
Month
# of Sales
Avg. LP
Avg. SP
Median LP
Median SP
Feb
224
$2,298,797
$2,257,334
$1,719,500
$1,758,000
March
252
$2,295,629
$2,260,524
$1,800,000
$1,825,000
April
357
$2,396,667
$2,403,962
$1,799,900
$1,828,000
May
300
$2,596,992
$2,581,715
$1,900,000
$1,994,500
June
348
$2,509,175
$2,537,953
$1,900,000
$1,967,500
July
311
$2,421,326
$2,442,738
$1,795,000
$1,855,000
Aug
268
$2,415,075
$2,438,934
$1,897,000
$1,950,000
Sept
278
$2,479,440
$2,445,817
$1,899,000
$1,987,500
Oct
248
$2,754,470
$2,705,071
$1,899,000
$1,899,500
Nov
199
$2,713,693
$2,707,359
$1,999,000
$2,100,000
Dec
189
$2,686,126
$2,664,391
$1,985,000
$2,157,500
Jan
140
$2,828,988
$2,855,213
$2,234,944
$2,240,000
Feb
158
$3,063,331
$3,108,907
$2,149,500
$2,386,500
Mar
207
$3,247,251
$3,337,348
$2,400,000
$2,625,000
Apr
227
$3,190,161
$3,251,604
$2,350,000
$2,550,000
May
215
$2,943,657
$3,032,977
$2,350,000
$2,500,000
Jun
190
$2,864,089
$2,872,690
$2,297,500
$2,350,000
Jul
155
$2,889,612
$2,832,080
$2,299,900
$2,300,000
Aug
164
$2,933,243
$2,830,855
$2,200,000
$2,150,000
Sep
135
$2,650,642
$2,560,314
$2,149,000
$2,040,000
Oct
124
$3,090,320
$2,971,211
$2,272,500
$2,212,500
Nov
115
$2,581,790
$2,459,974
$1,950,000
$1,875,000
Dec
100
$2,859,960
$2,675,549
$2,097,500
$1,892,500
Jan
96
$3,032,101
$2,897,135
$2,197,500
$2,075,000
In the months when the average and median sales prices increased, it didn’t mean your home’s value went up – it just means that the set of homes were a little bigger and nicer than other months.
The number of sales is the real indicator. Fewer and fewer homes are deserving of today’s pricing.
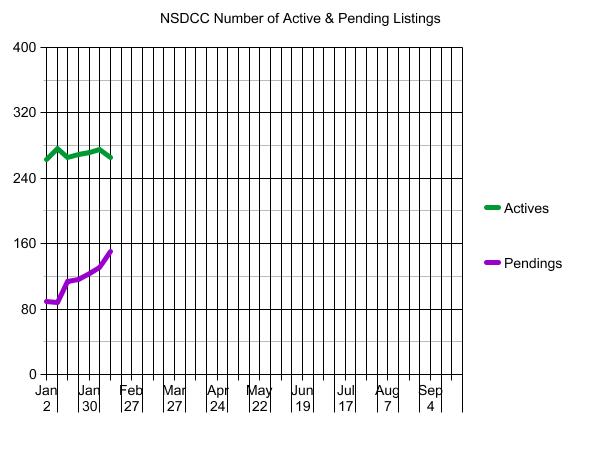
There were 182 NSDCC listings in January, as of today – which means we have a clear winner, even if a few more listings get added by late-reporters.
Congratulations Rob Dawg!
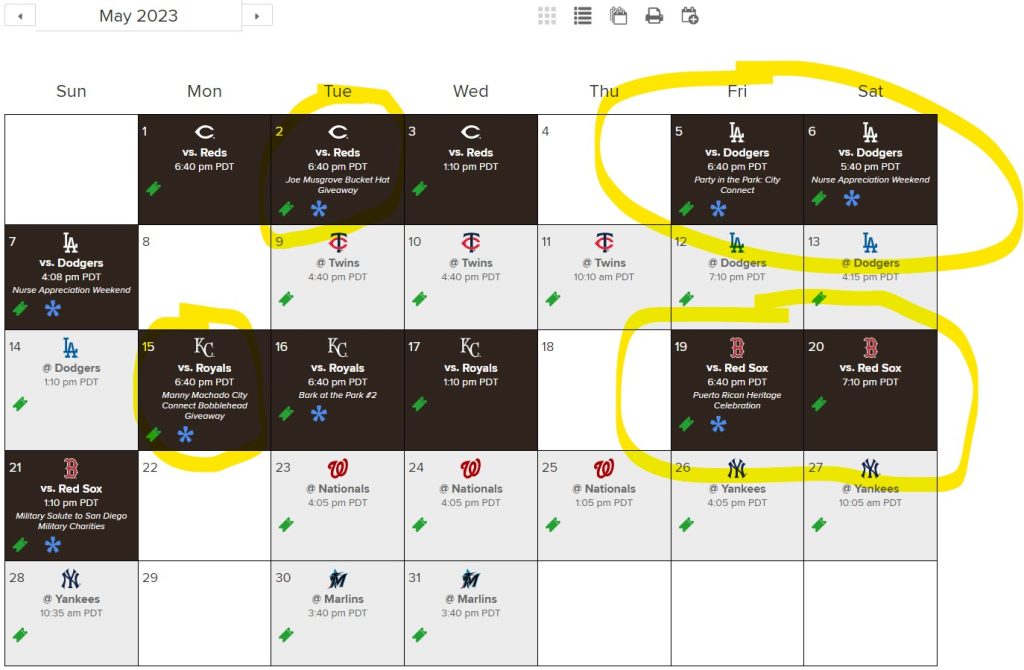
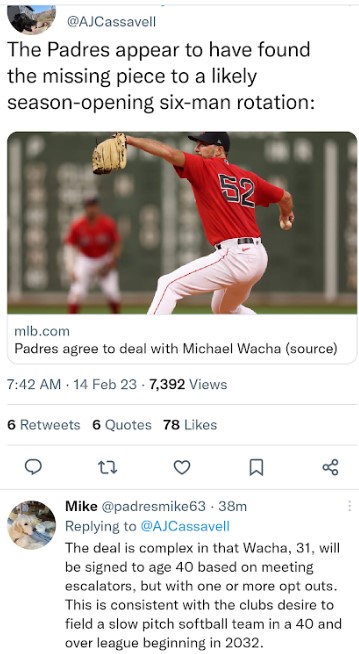
The season starts on March 30th, and May looks like a great month to attend a game. What might be the two best giveaways of the season (vs. the Reds and the Royals) happen that month, plus the Dodgers make their first visit back to Petco Park.
Dawg’s favorite team, the Red Sox, also return in May!
The summary of guesses, with some additions from the FB page:
16 Noodle
89 Momento
99 Tom
104 BWell_SoCal
111 Majeed
115 Lifeisradincbad
117 Susie
119 Beachside
120 Curtis
128 Joe
130 Rob
136 Skip
140 Haile
142 MC
146 Derek
152 Drew
158 Susan
160 doughboy
165 Kingside
174 SurfRider
175 Sciguy 186 Rob Dawg
190 Bode
200 Jeff Campbell
203 Lauren Stickelman
213 Shadash
252 Aunt Nancy
262 Eddie89
298 Nick
333 Sherman Messing
149 Median
This was the first time that the actual count of January listings landed in the upper third of the guesses. But don’t get giddy about the inventory just yet – here’s how it compares:
NSDCC January Listings:
2018: 426
2019: 418
2020: 354
2021: 289
2022: 223
2023: 182
The lack of choices is what causes hyper-frenzy conditions – it causes buyers to freak out. When a top-quality listing hits the market, buyers feel like this might be their only chance this month, or this year, to buy such a good match to their needs – and then the lack of transparency makes them go nuts.
It’s going to be a wild and crazy season – and not just for the Padres!
This is the house that received THIRTY offers last month.
My thoughts:
The supply of houses priced under $700,000 is scarce, with overwhelming demand.
This is all you’re going to get from now on, and it won’t get better. I feel sorry for the kids.
My buyers offered $700,000 with 20% down and didn’t get a counter.
The listing agent didn’t round-trip it and the winner paid $730,000 and financed the purchase. How do you know if others would have made a better offer if you don’t include them?
When mortgage rates started going up last year, I said all we have to do is survive until springtime – and it looks like we’ve made it!
Not only did our local market not crash and burn, it held up pretty well – and that’s in spite of the higher rates and blistering doomer attack over the last eight months.
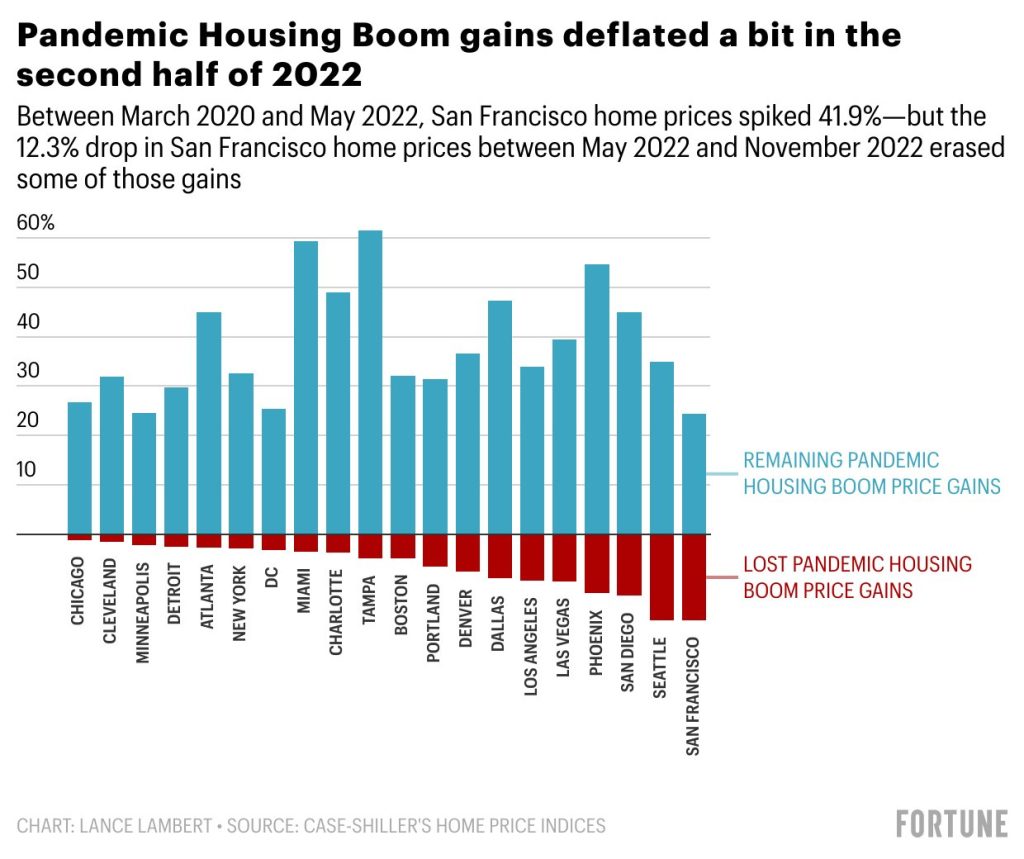
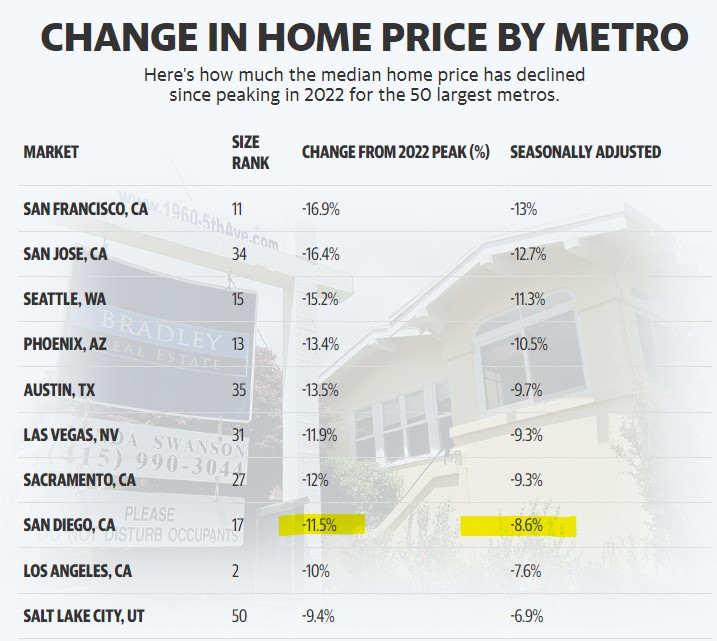
The San Diego Case-Shiller NSA stats:
Mar 2020: 268.19
May 2022: 421.29 (+57%)
Nov 2022: 390.22 (-7%)
I don’t know where the -7% is happening, but around the NSDCC, the pricing hasn’t changed much.
The spring season should run hot through May, and by then the mortgage rates AND prices will probably be higher. The second half of 2023 will likely be sluggish, at best.