Look at how the detached-home market between La Jolla and Carlsbad has started in 2023:
NSDCC January Sales: 96
I had given up all hope of hitting 100 sales in January, but it is within sight now.
NSDCC January Listings: 182
A few more than expected which is fantastic – we NEED more homes to sell.
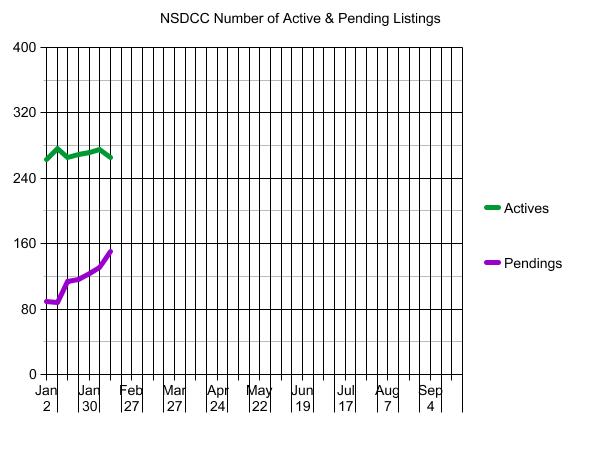
NSDCC Active Listings: 265 (ten fewer than last week!)
No flood yet, and none expected.
NSDCC Pending Listings: 150 (15% higher than last week)
The demand appears to be strong enough, and the average DOM has dropped in all categories:
The $0 – $1,500,000 Market:
| Date |
NSDCC Active Listings |
Avg. LP/sf |
Avg. DOM |
# of Pendings |
| Jan 2, 2023 |
22 |
$719/sf |
75 |
15 |
| Jan 9 |
26 |
$687/sf |
50 |
14 |
| Jan 16 |
23 |
$701/sf |
52 |
20 |
| Jan 23 |
25 |
$751/sf |
60 |
21 |
| Jan 30 |
23 |
$788/sf |
45 |
25 |
| Feb 6 |
18 |
$750/sf |
59 |
24 |
| Feb 13 |
18 |
$770/sf |
48 |
26 |
The $1,500,000 – $2,000,000 Market:
| Date |
NSDCC Active Listings |
Avg. LP/sf |
Avg. DOM |
# of Pendings |
| Jan 2, 2023 |
45 |
$809/sf |
60 |
18 |
| Jan 9 |
55 |
$828/sf |
53 |
19 |
| Jan 16 |
46 |
$838/sf |
53 |
30 |
| Jan 23 |
43 |
$793/sf |
52 |
31 |
| Jan 30 |
40 |
$778/sf |
54 |
34 |
| Feb 6 |
42 |
$814/sf |
46 |
30 |
| Feb 13 |
35 |
$823/sf |
51 |
39 |
The $2,000,000 – $3,000,000 Market:
| Date |
NSDCC Active Listings |
Avg. LP/sf |
Avg. DOM |
# of Pendings |
| Jan 2, 2023 |
52 |
$869/sf |
69 |
30 |
| Jan 9 |
57 |
$940/sf |
66 |
31 |
| Jan 16 |
50 |
$948/sf |
61 |
36 |
| Jan 23 |
51 |
$949/sf |
58 |
35 |
| Jan 30 |
54 |
$964/sf |
55 |
34 |
| Feb 6 |
60 |
$930/sf |
51 |
42 |
| Feb 13 |
51 |
$1,038/sf |
52 |
47 |
The $3,000,000 – $4,000,000 Market:
| Date |
NSDCC Active Listings |
Avg. LP/sf |
Avg. DOM |
# of Pendings |
| Jan 2, 2023 |
29 |
$1,236/sf |
85 |
6 |
| Jan 9 |
29 |
$1,180/sf |
80 |
5 |
| Jan 16 |
31 |
$1,196/sf |
73 |
8 |
| Jan 23 |
33 |
$1,201/sf |
71 |
7 |
| Jan 30 |
37 |
$1,218/sf |
70 |
6 |
| Feb 6 |
34 |
$1,236/sf |
75 |
12 |
| Feb 13 |
43 |
$1,333/sf |
68 |
11 |
The $4,000,000+ Market:
| Date |
NSDCC Active Listings |
Avg. LP/sf |
Avg. DOM |
# of Pendings |
| Jan 2, 2023 |
121 |
$1,744/sf |
126 |
21 |
| Jan 9 |
119 |
$1,716/sf |
123 |
20 |
| Jan 16 |
120 |
$1,761/sf |
121 |
26 |
| Jan 23 |
122 |
$1,707/sf |
119 |
27 |
| Jan 30 |
120 |
$1,680/sf |
121 |
30 |
| Feb 6 |
125 |
$1,714/sf |
118 |
28 |
| Feb 13 |
121 |
$1,750/sf |
116 |
32 |
NSDCC Weekly New Listings and New Pendings
| Week |
New Listings |
New Pendings |
Total Actives |
Total Pendings |
| Jan 2, 2023 |
11 |
6 |
263 |
89 |
| Jan 9 |
36 |
15 |
277 |
88 |
| Jan 16 |
36 |
34 |
266 |
114 |
| Jan 23 |
36 |
22 |
269 |
116 |
| Jan 30 |
32 |
25 |
272 |
123 |
| Feb 6 |
46 |
33 |
275 |
131 |
| Feb 13 |
30 |
35 |
265 |
150 |
NSDCC Weekly LP Quartiles
| Week |
1st Quartile |
2nd Quartile (Median LP) |
3rd Quartile |
| Jan 2, 2023 |
$2,095,000 |
$3,695,000 |
$5,995,000 |
| Jan 9 |
$1,990,000 |
$3,495,000 |
$5,775,000 |
| Jan 16 |
$2,000,000 |
$3,574,000 |
$5,995,000 |
| Jan 23 |
$2,099,000 |
$3,595,000 |
$5,999,000 |
| Jan 30 |
$2,195,000 |
$3,525,000 |
$5,942,000 |
| Feb 6 |
$2,195,000 |
$3,598,000 |
$6,845,000 |
| Feb 13 |
$2,300,000 |
$3,795,000 |
$6,495,000 |
For previous years, click here:
https://www.bubbleinfo.com/category/inventory/


0 Comments