

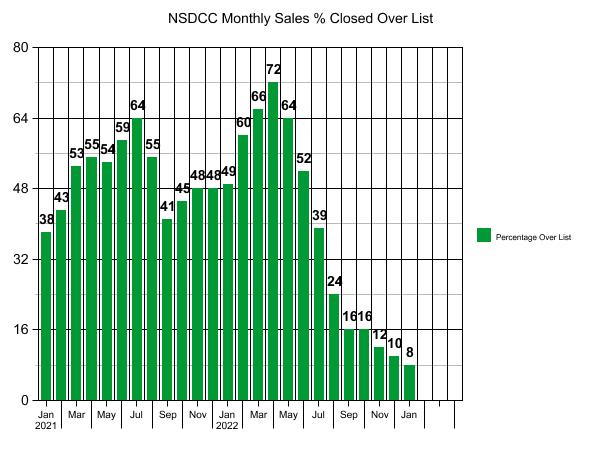
Paying over the list price wasn’t a new thing created by the frenzy – there have always been over-list sales in the past. But getting down to 8% last month begged for a comparison to a previous January!
In January, 2019 there were 151 NSDCC sales, and 18 of them (12%) closed over the list price. Of the eighteen, seven were among the 37 sales that closed under $1,000,000 (which were a quarter of all sales).
Thirty of the 37 sales under $1,000,000 closed for less than full price?
Last month, we didn’t even have ANY sales that closed under a million!
With 92% of closings last month selling for list price or less, it must mean that today’s sellers are more willing to ‘give away’ their home. They have gained huge gobs of equity in the last couple of years, and only the seriously-motivated sellers would dare try to sell their house in a ‘bad’ market. If they need to give back a bigger portion to make the deal, they might do it.
Let’s predict the next few months.
Sellers will still try to get full retail, and based on the over-list stats from last month, 10% or less will get it. The rest will be priced to sit, and after 30+ days on the market, be prone to receiving lowball offers.
This is where the 2023 Spring Selling Season will be made. Will 80% to 90% of sellers take a low offer?
~~~~~~~~~~~~~~~~~~~~~~~~~~~~~~~~~~~~~~~~~~~~~~~
NSDCC Average and Median Prices by Month
| Month | |||||
| Feb | |||||
| March | |||||
| April | |||||
| May | |||||
| June | |||||
| July | |||||
| Aug | |||||
| Sept | |||||
| Oct | |||||
| Nov | |||||
| Dec | |||||
| Jan | |||||
| Feb | |||||
| Mar | |||||
| Apr | |||||
| May | |||||
| Jun | |||||
| Jul | |||||
| Aug | |||||
| Sep | |||||
| Oct | |||||
| Nov | |||||
| Dec | |||||
| Jan |
In the months when the average and median sales prices increased, it didn’t mean your home’s value went up – it just means that the set of homes were a little bigger and nicer than other months.
The number of sales is the real indicator. Fewer and fewer homes are deserving of today’s pricing.


Interest rates are still going up which is going to make over list prices less likely to happen.
Prices have been going up for 15 years. Paying 10% under list isnt unreasonable.
This is the problem with getting all rah rah about the market. Yes, it’s not that bad right now however you need to get 2 parties to the table. If sellers think theyll make more tomorrow theyll only accept over list. If buyers think prices will only go down theyll lowball and wait.