Open House Report
There are plenty of reasons not to buy – find a reason TO buy a house:

There are plenty of reasons not to buy – find a reason TO buy a house:
It’s happened before – rates go down in spite of Fed. Thanks daytrip:

There have been other projects in Carlsbad that faced an uproar. This time the complaints have ranged from gnatcatchers, to Indian remains, to increased traffic, to competition for mom-and-pop store owners.
Whatever the gripe, those who oppose had better get to a city council member or two by Tuesday, or it’s going to be over. The city council has been mum about their votes, but they have been cushy with the developer for three years.
Every day we hear some pundit talking about the latest real estate bubble forming. Can we learn anything from comparing recent sales to those during the bubblicious 2004-2007 era?
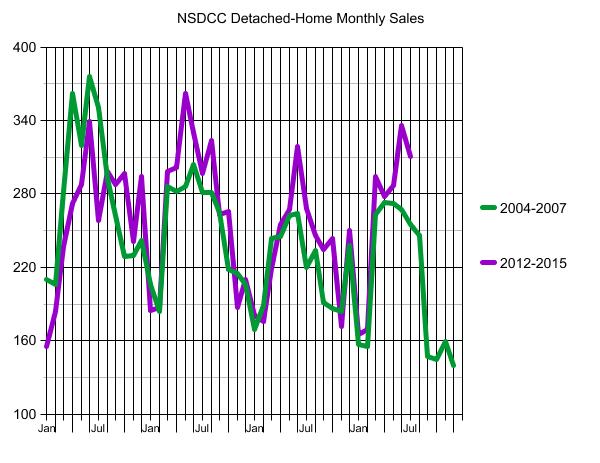
Sales were dropping precipitously in 2005 and 2006 after the 2003-2004 run-up. There was one last blowout at the end of 2006 and into 2007 when Countrywide began pushing the no-doc, 100% financing up to $1,500,000.
When Angelo took away the punch bowl in the middle of 2007, the party was over – you can see how sales tanked, beginning in August, 2007.
One big difference when comparing these two eras is that the neg-am teaser rate in 2007 is today’s 30-year fixed rate. When the teaser rate went away, and people had to qualify again, the market collapsed.
It doesn’t look that way today.
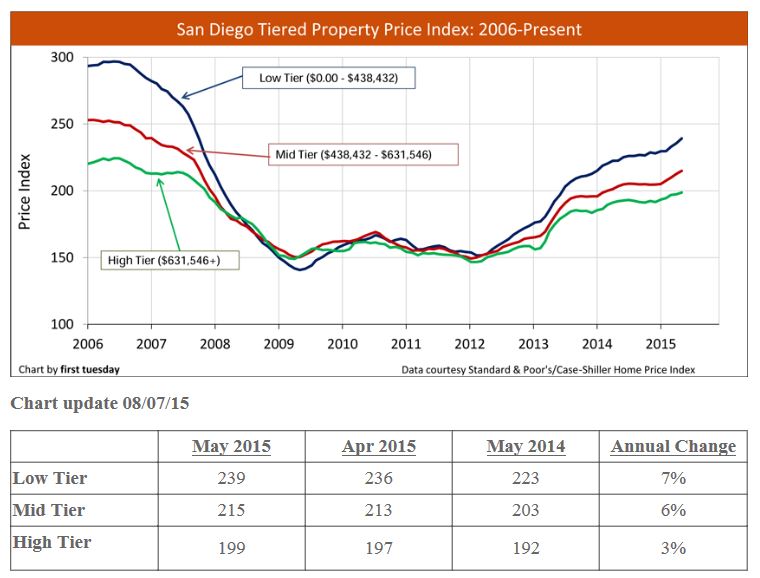
This year, sales have been strong, in spite of the San Diego Case-Shiller Index rising 42% since January, 2012. If we hit an unsustainable stretch, the first indicator will be sales dropping off, like they did at the end of 2007.
Let’s describe the frenzy era…..so far:
2012: Rev the engines, we have liftoff.
2013, first half: Full tilt boogie, prices going up as fast as they can.
2013, second half: Mortgage rates rise 0.75% to snuff out price rally.
2014: Normalizing.
2015: Rates dip under 4% to begin the spring selling season, sparking a rally.
If the Fed does raise a rate this year, it won’t be much – maybe 0.25%. We will survive a similar bump in mortgage rates, and it might be a relief for it to have finally happened.
http://journal.firsttuesday.us/california-tiered-home-pricing-2/1592/
From the WSJ:
http://www.wsj.com/articles/u-s-existing-home-sales-rise-to-pre-recession-pace-1440079684
WASHINGTON—Sales of existing homes climbed in July to their prerecession pace, but low inventory and higher prices threaten to curtail those gains heading into the fall.
Existing-home sales rose 2% last month from June to a seasonally adjusted rate of 5.59 million, the National Association of Realtors said Thursday. Last month’s sales pace was the highest since February 2007 and 10.3% higher than a year earlier.
Despite relatively steady gains in home sales in the past year, thinning supply and high prices loom as headwinds that could slow the recovery. As well, mortgage rates could be poised to rise when the Federal Reserve raises short-term interest rates, potentially as soon as next month.
Total housing inventory fell 0.4% at the end of July to 2.24 million existing homes available for sale, 4.7% lower than a year ago. At the current pace of sales it would take 4.8 months to exhaust the supply of homes on the market, down from 5.6 months a year ago, the NAR said Thursday.
Jim Klinge, a real-estate agent in San Diego, said inventory is low in his area because residents are reluctant to move to another town or state. In prior years, high prices would encourage some people to sell and leave town, he said.
He said every new listing generates intense interest from buyers, such as a three-bedroom home he listed Saturday night at $579,000 for which he had already received 30 queries by Thursday.
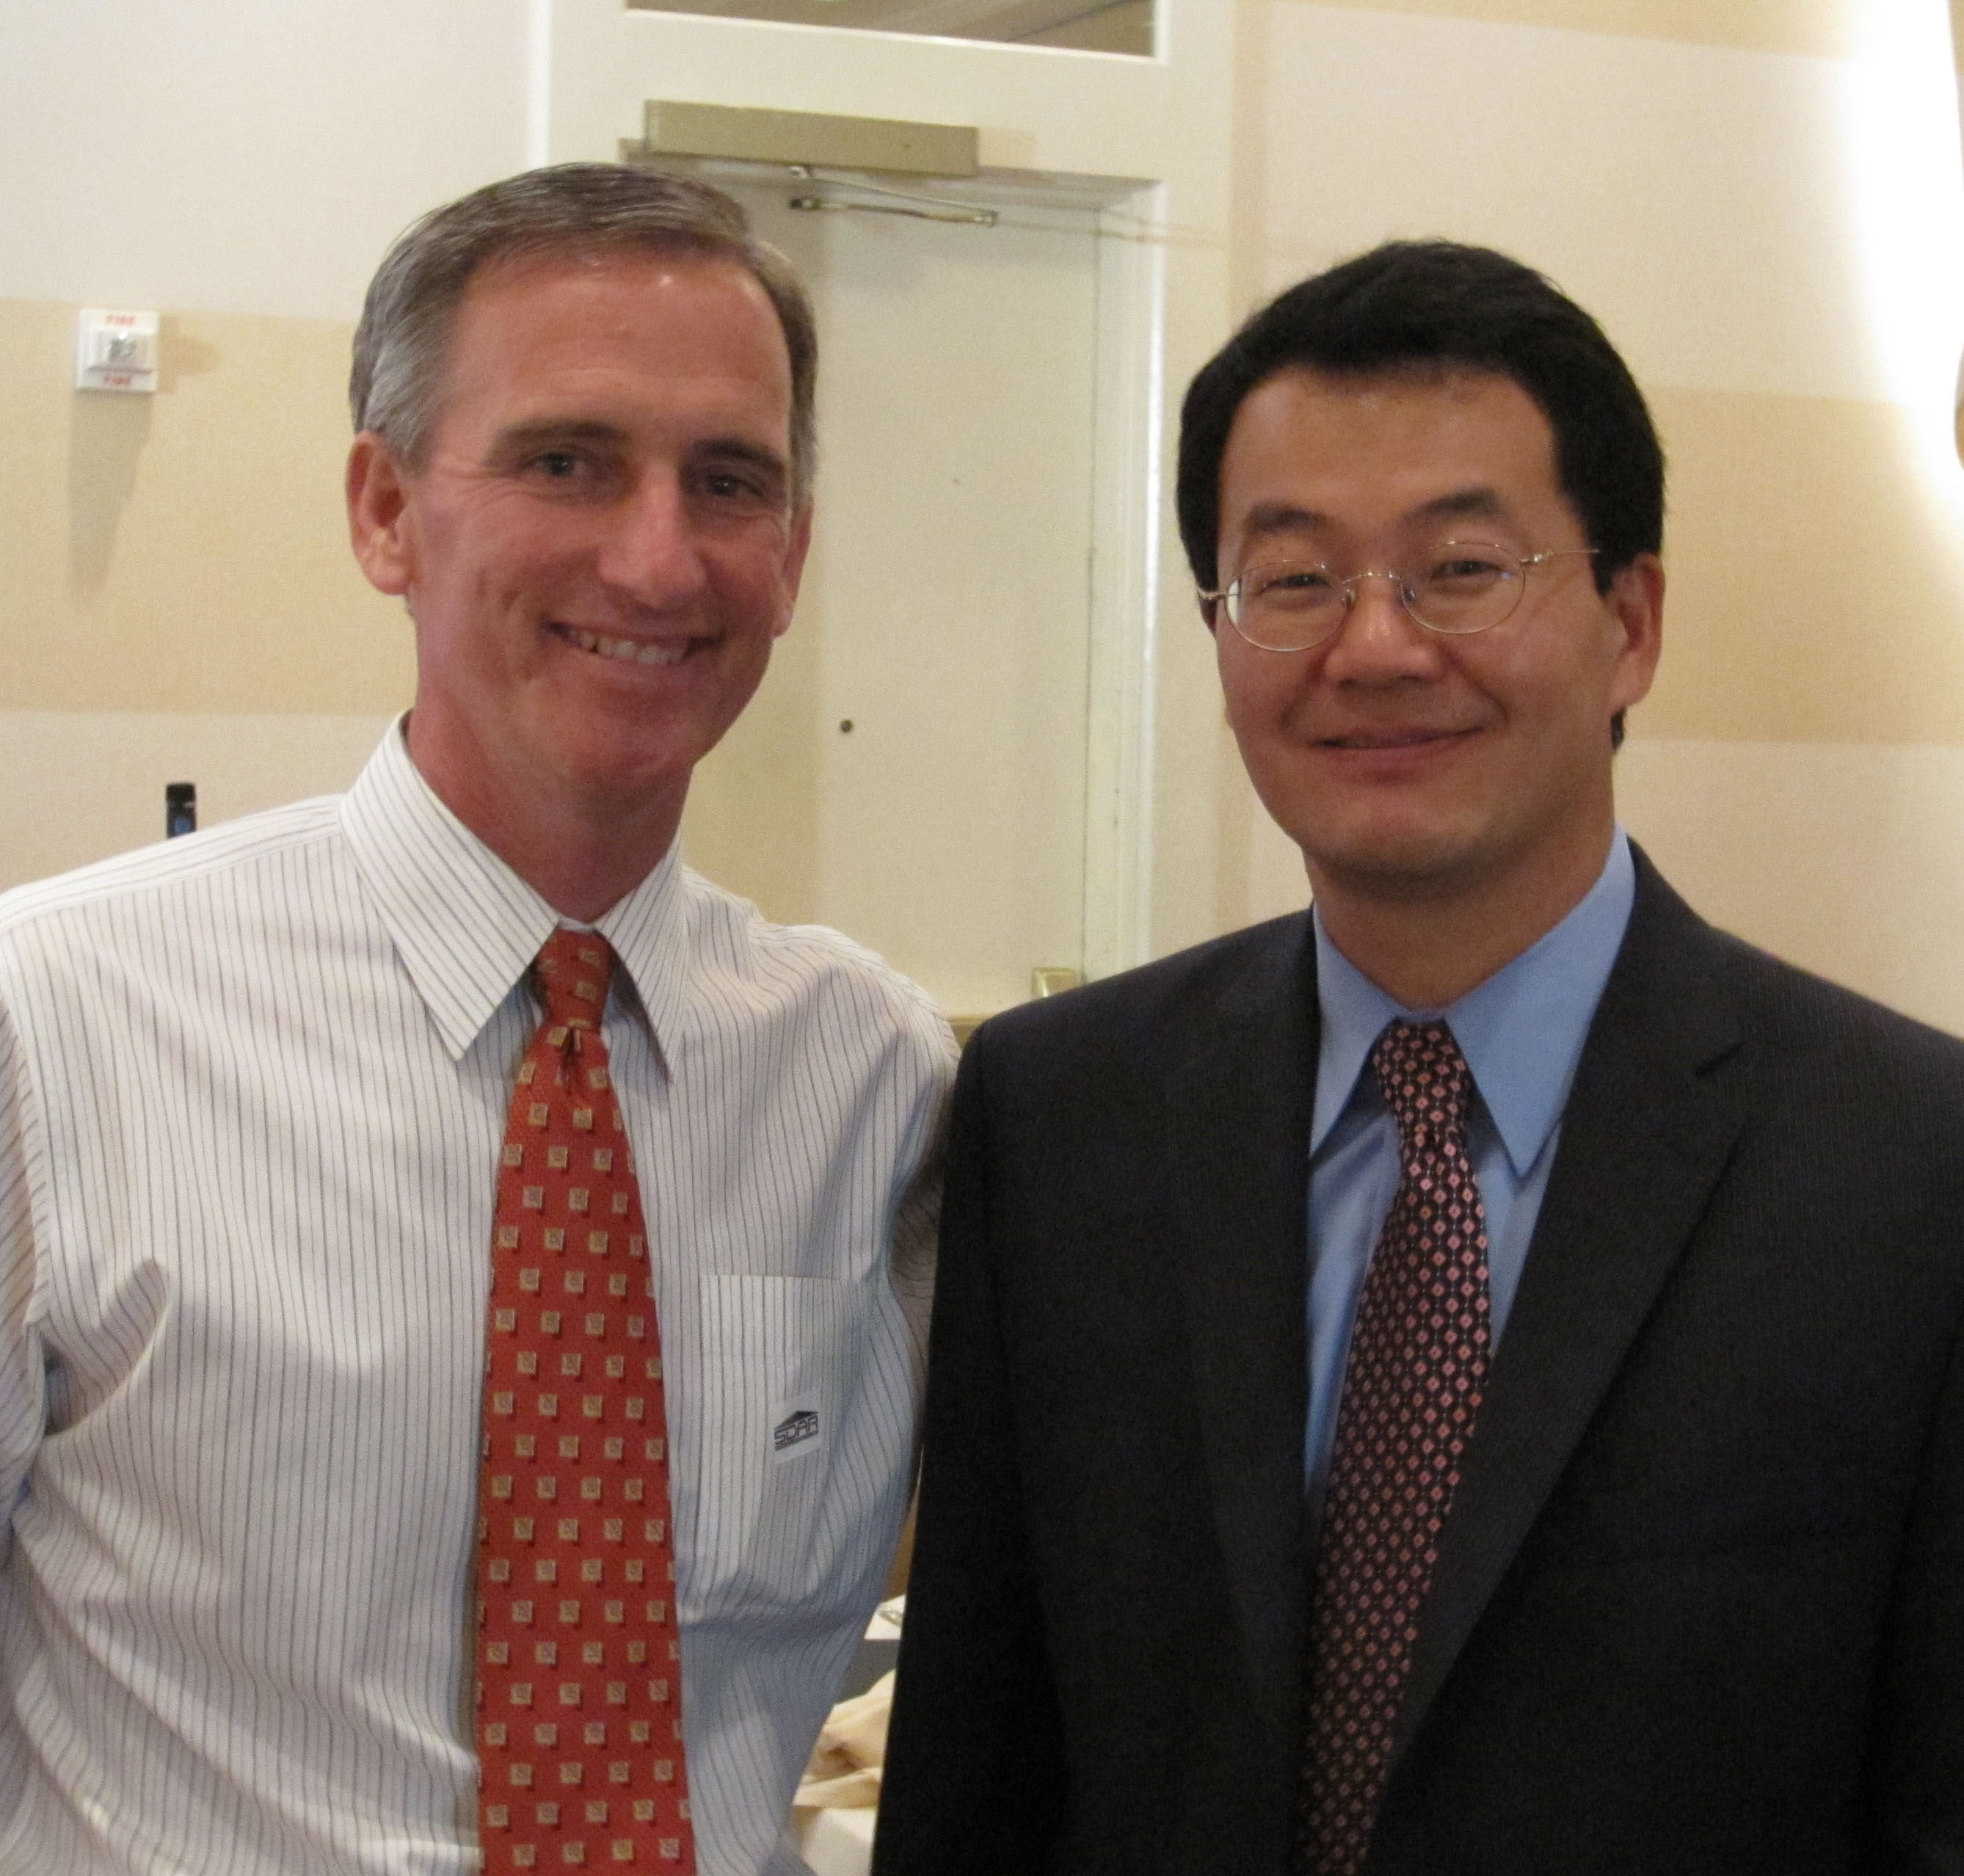
“We have to recognize that we have a broad-based housing shortage,” said Lawrence Yun, the NAR’s chief economist. “Home builders have been essentially out of the game or underproducing” since the crash.
The median sale price for a previously owned home slipped slightly to $234,000 from June’s $236,300, but is still 5.6% higher than a year earlier. July’s prices mark the 41st straight month of year-over-year price gains.
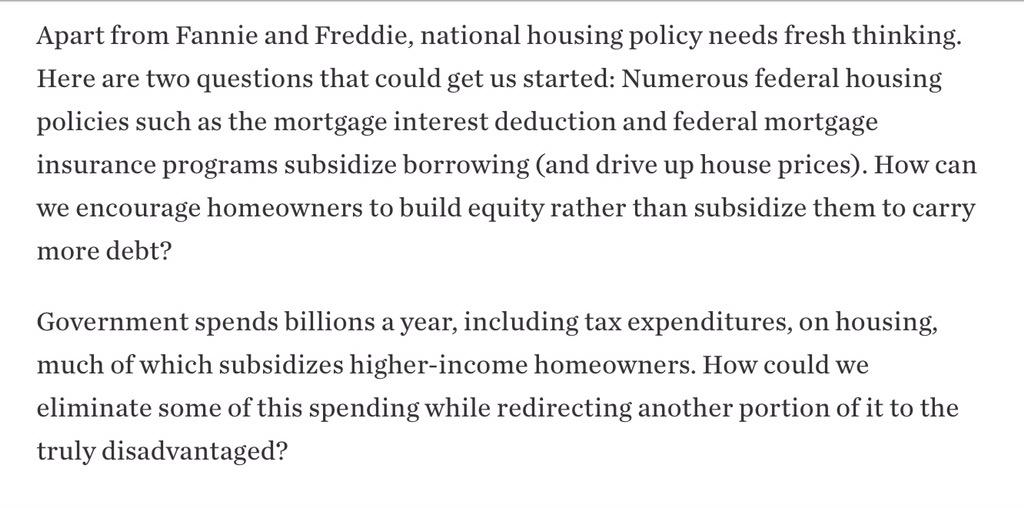
I saw these questions from Ed DeMarco on Twitter. My answers:
1. Have the M.I.D. apply towards primary residence only (not second homes), and lower from $1,000,000 to $500,000. Those buying in hopes of a bigger write off will still buy a house, and take the partial benefit – and be in it for the appreciation and to raise a family (make wifey happy).
2. Have the mortgage interest deduction be in effect for the first ten years of ownership only. It would encourage borrowers to pay off mortgages in the ten years, and not refinance every year.
3. Require that only the buyers can pay for mortgage insurance (sellers can pay in full now).
4. Redirect the disadvantaged folks to subsidized rentals until they aren’t disadvantaged. Only stable, secure, affluent people should buy a house – it’s too late for the rest, unless they drive to the suburbs/outer edge of town.
5. There are several loan programs available to help the disadvantaged already. NACA is still around, helping buyers purchase with no down payment and no closing costs (H/T daytrip):
https://www.naca.com/naca/purchase/purchase.aspx
6. Lower the capital-gains tax for 1-2 years to incentivize those reluctant-but-motivated possible sellers to unload a rental property or two. Cut federal rate to 10% for the first year (currently 20%), and then back to 15% in the second year. The crotchety old guys still won’t sell, so there won’t be a flood. But more inventory = more sales while stabilizing prices.
7. Keep Fannie/Freddie the way they are for now. If they can keep operating in the black, let’s allow the mortgage industry to enjoy the fluidity. I attended a seminar today on the new loan disclosures coming on October 3rd, and it is clear that Fannie/Freddie will be extremely strict on compliance. It doesn’t mean tougher credit, it means the mortgage industry needs to submit the cleanest loan packages ever – which is good for the taxpayers.
8. The new compliance crunch will virtually eliminate mortgage brokers – wholesale lenders won’t want to take a chance on them. Yes, we still have room for you over here to be a realtor – there’s only 11,000 of us chasing 3,500 sales each month.
9. Encourage a private jumbo-MBS market without subsidizing it. Eventually, a private MBS marketplace could help shift the burden from Fannie/Freddie.
10. Run a tight ship. We can handle it.
The powers-that-be have made some great moves to get us this far, now bow out gracefully and let free enterprise take care of the rest.

We can talk, can’t we?
Houses that have been on the market for more than 60 days (which includes 507/1,079 = 47% of NSDCC active listings) missed the hot season.
Buyers presume,
“If it hasn’t sold by now, something is wrong with the house, or the price.”
Some people use the days-on-market statistic has a primary search feature. Even if the list price has been reduced, just the longer market time can cause buyers and agents to miss the longer-listed properties.
So not only are those listings easier to pass up, the buyer pool in general is shrinking due to the time of year. It’s too easy for them to pack it in.
It’s going to get tougher for the older listings to find a buyer, unless they get aggressive on price. But how many sellers will knock 5% to 10% off their price? Not many.
Hypothesis:
1. The list price has to be at least 10% wrong if not selling for months.
2. Most unsold listings aren’t that far off. Buyers would be interested in many of the active listings at 10% to 15% under list.
3. Sellers are reluctant to chop that much off their price.
4. Buyers have to take the initiative.
My game plan here:
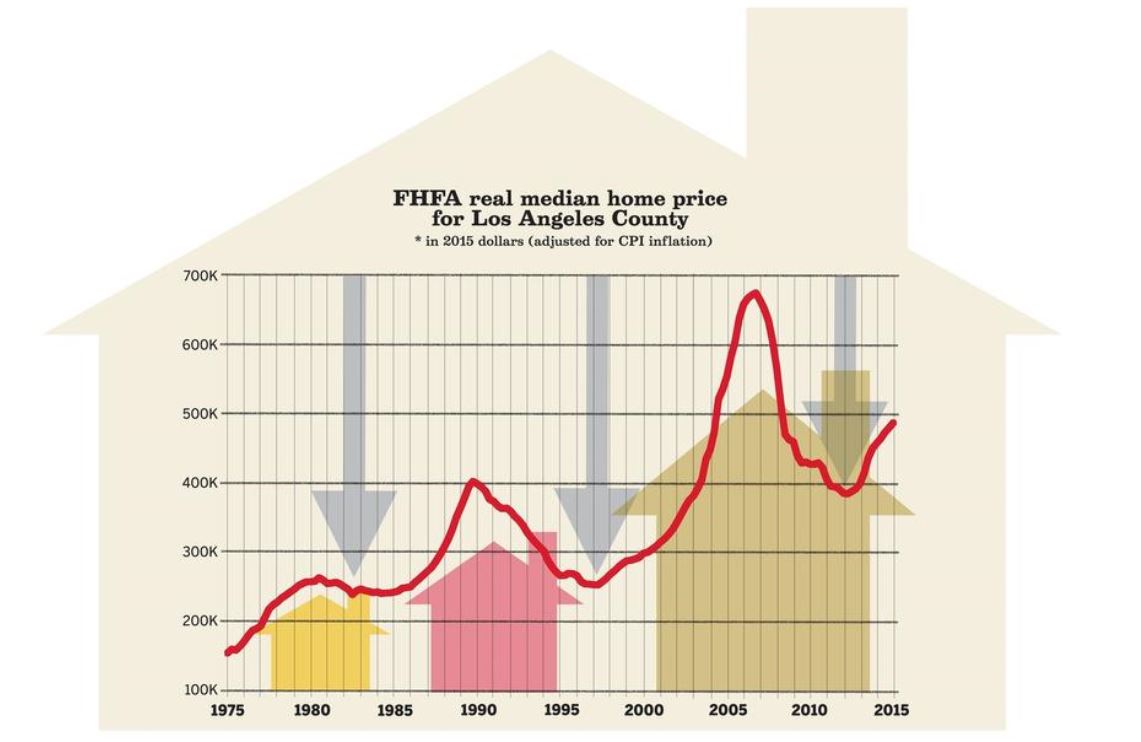
This is what you get when a college professor looks at today’s real estate market – faulty assumptions. 1) The graph he included shows the two years (2012-2013) of rapid appreciation; and 2) the building-permit numbers are skewed by the lack of land available, plus 3) rapidly rising rents help to reduce the home-price-to-rent ratio.
From the latimes.com:
http://www.latimes.com/opinion/op-ed/la-oe-0818-yu-la-housing-bubble-20150819-story.html
If history is any guide, the L.A. housing price cycle seems to last about 12 years on average, of which seven years is spent in the bull market with at least 65% real price appreciation, and five years is spent in the bear market. We are three years into the housing recovery that started in 2012, with 27% appreciation so far. On average, there will be four more years or 38% more price growth before we reach the turning point.
Of course, it’s possible the bear market could come earlier or later than four years, but that is quite unlikely to happen in the very near future.
How can I be so sure? Often, during a bubble-making period, we see an accelerating rate of home price appreciation, as in 1988-89 and 2004-06. In the last two years, we haven’t seen that kind of rapid appreciation in Los Angeles.
Another way to understand housing price cycles is by looking at building permit numbers. Speaking roughly, if developers are investing in new properties, that’s a good sign that demand, and prices, are rising or keeping steady. If developers are holding back, that suggests demand, and prices, will soon fall.
L.A. housing permit units peaked in 1977, 1988 (50,500 units) and 2004 (26,900 units), one to three years ahead of the real housing price peaks in 1980, 1989 and 2006. Permits bottomed in 1982, 1993 (7,300 units) and 2009 (5,700 units), a few years before the housing price troughs in 1984, 1997 and 2012.
Over the last three years, we have seen L.A. building permits increase from 11,200 units in 2012 to 18,200 units in 2014. The 2015 number will most likely be higher than 2014. Therefore, we can predict the next home price peak is at least two years away.
Yet another measure of rational housing value is a simple price-to-rent ratio. The ratio is calculated by taking the median home price over the annual median rent in L.A. If the ratio is high — meaning that home prices are beyond their fundamental value based on expected rental revenues — that points to a bubble. Again, let’s look at history.
Two previous peaks were in December 1989, with a ratio of 14.8 to 1, and in February 2006, with a ratio of 24.4. According to Zillow, the current price-to-rent ratio in L.A. was 17.1 in May, which is far below the 2006 bubble level but still higher than any time before 2003.
That doesn’t worry me, though. A high ratio doesn’t spell danger for Los Angeles because, similar to New York (ratio: Manhattan 25, Brooklyn 23) and San Francisco (ratio: 21), it’s now a “superstar” city. L.A.’s size, amenities, weather and geography make its houses an investment target for the global elite. Wealthy individuals from all over the world don’t care that it might make more financial sense to rent, because they’re not simply buying Los Angeles houses to live in them, they’re also trying to diversify their financial portfolios.
Even though Los Angeles is one of the least affordable cities in the U.S., all factors indicate that it is not in a housing bubble. Of course the bull market will end eventually, but that doesn’t mean we’re heading for a devastating crash, like in 1990 or 2007. Whether you should put up a million bucks for that bungalow is another story.


Are you looking for an experienced agent to help you buy or sell a home?
Contact Jim the Realtor!
CA DRE #01527365, CA DRE #00873197
