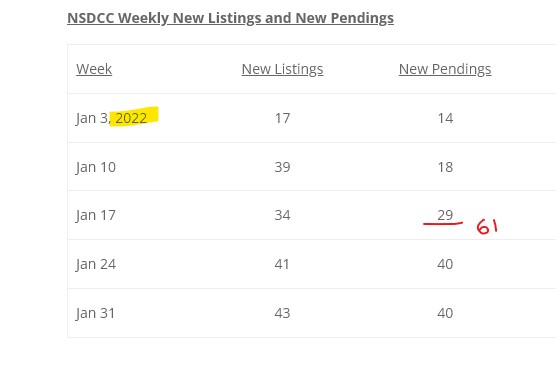
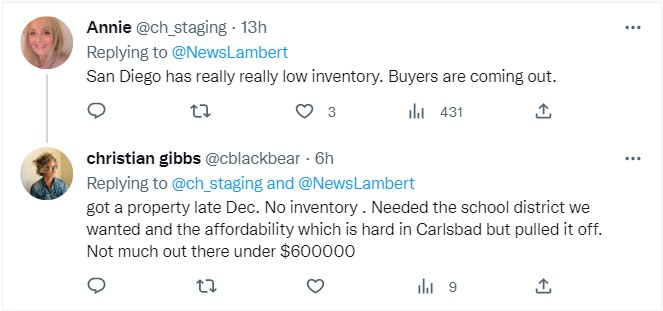
The chart above shows that there were 61 new NSDCC pendings through January 16th last year – when mortgage rates were in the low-3s and we were in full frenzy mode.
Through the 18th, there are 62 new pendings this month!
We are on about the same pace as last year? Who woulda thunk it?
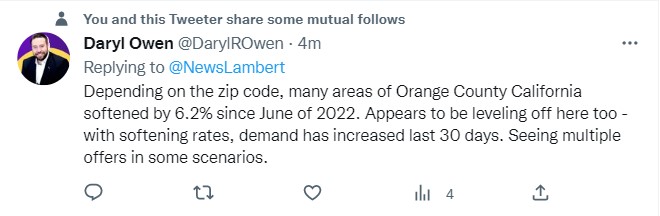
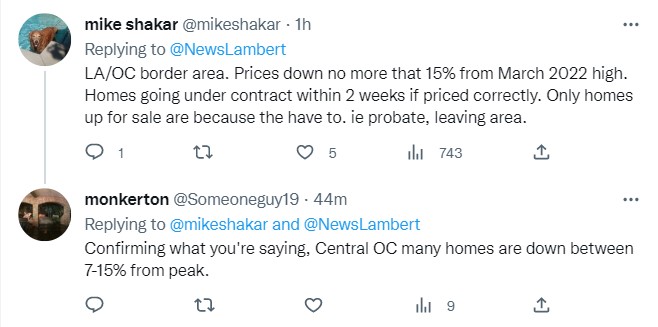
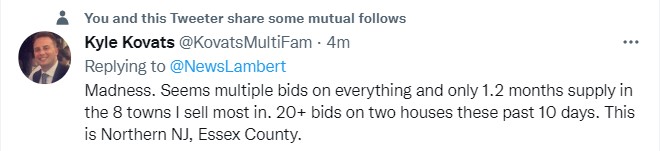
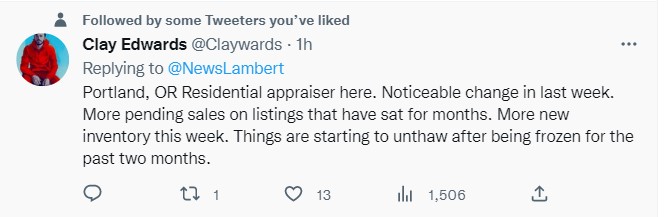
Some people haven’t gotten off the couch yet so it’s hard to say if all of the comments are an accurate depiction of what’s happening. But those who are willing to leave an upbeat tweet must feel pretty good about them, knowing that the wrath of real estate twitter will descend upon anything positive.
Solar is probably the most desirable upgrade for buyers. Hat tip to Eddie89 for sending this in:
Defying overwhelming public opposition, state officials voted in late 2022 to make drastic changes to California’s rooftop solar rules (called “net energy metering”).
Solar users under NEM3 will get 75% to 80% less from the utility for the extra solar energy they share with the grid. Compensation for that extra energy will go from an average of $.30 / kWh to around $.05 / kWh. NEM3 solar users will also be put on a rate plan with higher evening electricity rates. These changes will extend the payback period for a solar investment from an average of six years to more than ten years.
Here are some FAQs about the changes, often referred to as NEM3:
If you are a NEM1 or NEM2 customer and you sell your home, the new owner will take over the remainder of your 20-year lock-in period.
However, this will be different under NEM3, which has a shorter, 9-year lock-in period that is lost when a home is sold. This is another incentive for a home seller that has a fully paid off solar system that’s under either the NEM1 or NEM2 rules. The buyers get more solar bang for their bucks!
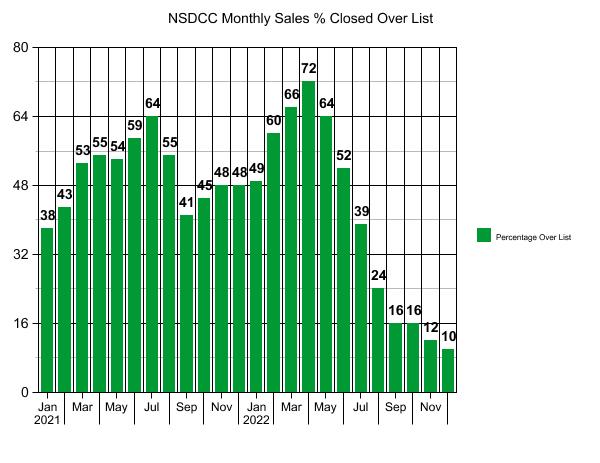
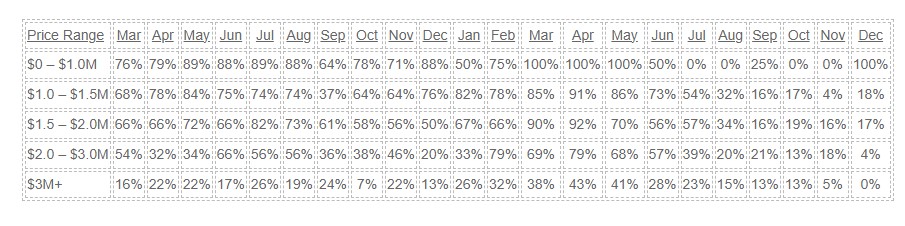
The number of December sales has been hanging right at 100 and ten closed above list, or 10%!
Percentage Of Sales Closed Above the List Price, by Price Range
If the over-list sales start to increase this spring and get above 20%, then the frenzy feelings are slipping back into the equation. Hopefully they will be accompanied by more than 100 sales, because if that’s all we have during the selling season, there should be real dogfights over the creampuffs.
~~~~~~~~~~~~~~~~~~~~~~~~~~~~~~~~~~~~~~~~~~~~~~~
NSDCC Average and Median Prices by Month
Month
# of Sales
Avg. LP
Avg. SP
Median LP
Median SP
Feb
224
$2,298,797
$2,257,334
$1,719,500
$1,758,000
March
252
$2,295,629
$2,260,524
$1,800,000
$1,825,000
April
357
$2,396,667
$2,403,962
$1,799,900
$1,828,000
May
300
$2,596,992
$2,581,715
$1,900,000
$1,994,500
June
348
$2,509,175
$2,537,953
$1,900,000
$1,967,500
July
311
$2,421,326
$2,442,738
$1,795,000
$1,855,000
Aug
268
$2,415,075
$2,438,934
$1,897,000
$1,950,000
Sept
278
$2,479,440
$2,445,817
$1,899,000
$1,987,500
Oct
248
$2,754,470
$2,705,071
$1,899,000
$1,899,500
Nov
199
$2,713,693
$2,707,359
$1,999,000
$2,100,000
Dec
189
$2,686,126
$2,664,391
$1,985,000
$2,157,500
Jan
140
$2,828,988
$2,855,213
$2,234,944
$2,240,000
Feb
158
$3,063,331
$3,108,907
$2,149,500
$2,386,500
Mar
207
$3,247,251
$3,337,348
$2,400,000
$2,625,000
Apr
227
$3,190,161
$3,251,604
$2,350,000
$2,550,000
May
215
$2,943,657
$3,032,977
$2,350,000
$2,500,000
Jun
190
$2,864,089
$2,872,690
$2,297,500
$2,350,000
Jul
155
$2,889,612
$2,832,080
$2,299,900
$2,300,000
Aug
164
$2,933,243
$2,830,855
$2,200,000
$2,150,000
Sep
135
$2,650,642
$2,560,314
$2,149,000
$2,040,000
Oct
124
$3,090,320
$2,971,211
$2,272,500
$2,212,500
Nov
115
$2,581,790
$2,459,974
$1,950,000
$1,875,000
Dec
100
$2,859,960
$2,675,549
$2,097,500
$1,892,500
In the months when the average and median sales prices increased, it didn’t mean your home’s value went up – it just means that the set of homes were a little bigger and nicer than other months.
But if you want to make comparisons, then these latest averages and medians are similar to October, 2021.
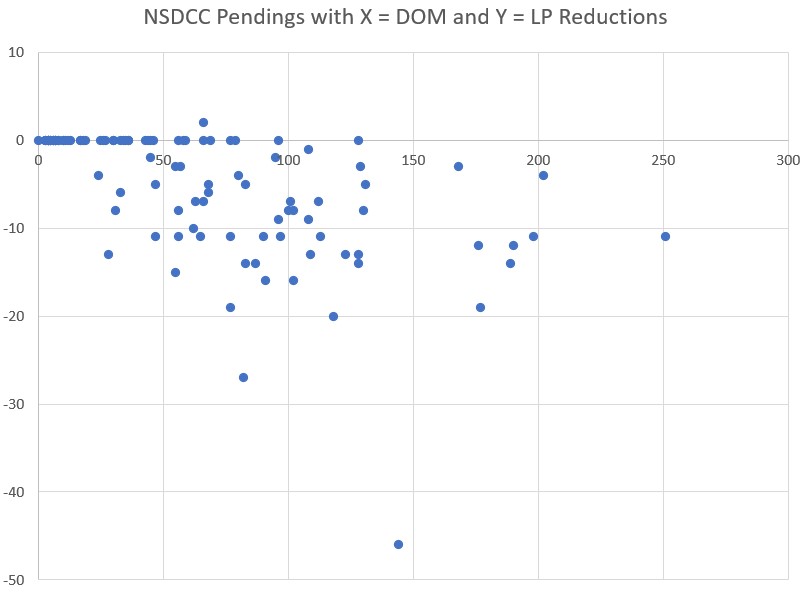
Yesterday, we saw that there has been a flurry of new pendings this month.
Could it be a result of brave buyers who have lowballed the sellers? We won’t know until they close escrow. But there is a direct correlation between how long a home has been on the market, and the discount expected by the buyers.
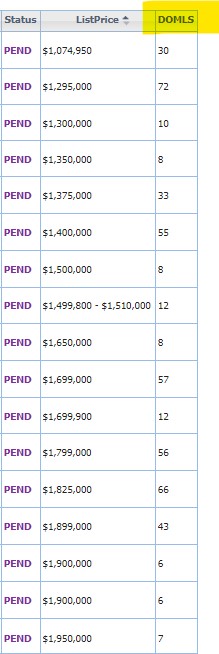
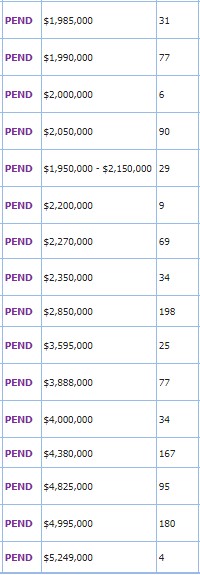
Of the current pendings, 49% didn’t lower their list price – and the median days on market for the whole group is 17 days. If the price is attractive, buyers will step up in the first two weeks and pay it, or close.
But once a NSDCC home is on the market for more than a month, and it can be a slippery slope – mostly because the showings dry up. Unless the sellers are willing to pour (more) money into upgrades, then the next best solution is to lower the price – but once you start lowering, it invites the lowballers. Yes, there were a handful that still went pending without reducing, but those were mostly the high-enders:
You see realtors advertising today to sellers that they need to price their home ‘right’. It’s a bit insulting, if you ask me, because it means they want you to price it at their price, not yours.
An attractive price is more than just money – it sums up the whole package (location, floor plan, condition, ease of showing, and listing agent competence) and causes the buyers to say, “Hey, that’s a nice deal!”
I suggested that buyers were merely vacationing from the housing hunt over last six months of the year, and some at the open houses this weekend confirmed that it was the case for them.
Last week the median days-on-market for the new pendings in January was 55 days, and it was this week too! We had as many new pendings in the last week as we had in the first two weeks of January combined!
It appears that buyers didn’t mind the prices so much – they just weren’t looking.
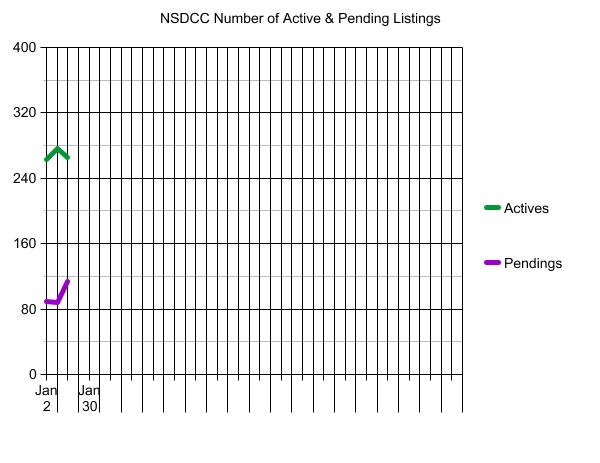
In the last week, there were 36 new listings and 34 new pendings! In the previous week, we also had 36 new listings but only 15 new pendings.
The total pendings count increased +30% in a week!
In the Under-$3,000,000 market, there are 119 actives and 86 pendings, which looks remarkably healthy.
We are about halfway through January, and there have been 80 new listings so far between La Jolla and Carlsbad. It means our contest should wind up around 160-170 listings.
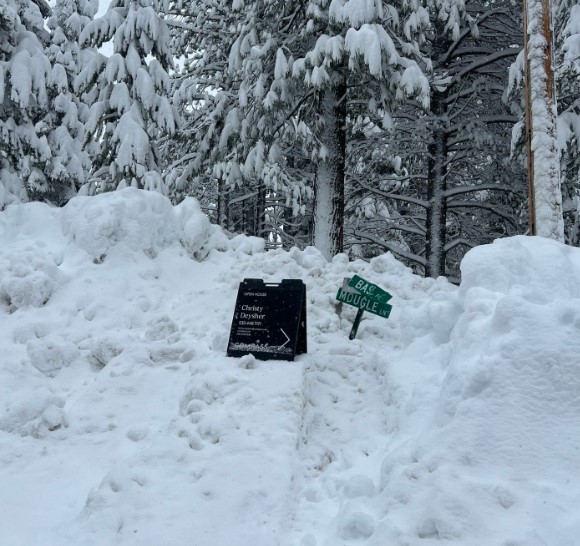
I checked my written count and I had 21 people in the first hour so Sunday’s total was more like 40 visitors. To have almost 100 people visit an open house this early in the year while raining both days is remarkable!
Have you noticed that the doomers are just speculating that the market is bad, mostly based on the median sales price? Is that all you got? Believe what you hear from the street.