The author first explored this topic in 2015, and this follow-up article was published in February:
Welcome to the Brave New Housing Cycle: Factors indicate that an extended housing boom is underway.
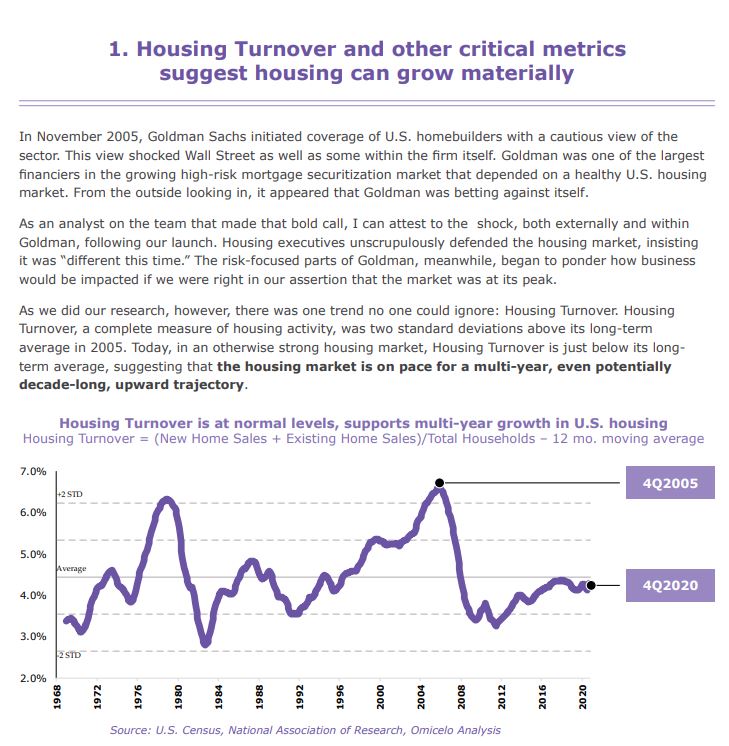
A new long-term housing boom is upon us. And COVID-19 is the main reason why.
Both housing and economic cycles used to last five to seven years, but the economy has shifted to longer cycles, due to factors such as technology and monetary policy. The housing market has followed suit and the result is what I have defined as the Brave New Housing Cycle, which is poised to last seven to 10 years.
The current Brave New Housing Cycle actually started last year.
Yesterday we saw that more than half of the NSDCC houses sold over the last couple of months have closed for a price that’s higher than their list price.
Another difference from previous years is the efficiency.
Typically, there are only around 55% to 60% of the listings that actually sell each year – mostly due to agents re-freshing their listings repeatedly, sellers changing their mind, and wrong pricing.
What a huge difference in the Covid Era.
We have fewer homes for sale, but more of them are selling:
NSDCC Listings Between December 1st and January 31st
Year
Number of Listings
Number of Listings Pending or Sold By March 12th
%
2020
526
253
48%
2021
460
328
71%
Before Covid was declared, we had come into 2020 with low rates and renewed optimism, and the market was active as participants were finding their way, price-wise. There were 48% of the early listings that found a buyer before Covid kicked in on March 12th.
This year, the higher-end market is healthy, but the Under-$2,000,000 is blistering hot:
NSDCC Listings Under $2,000,000 Between December 1st and January 31st
Year
Number of Listings Under $2M
Number of Listings Pending or Sold By March 12th
%
2020
329
206
63%
2021
237
210
89%
89%!
When you are telling your grandkids about THE GREATEST REAL ESTATE FRENZY OF ALL-TIME, come back to this page!
The trend of paying over the list price continues!
NSDCC Detached-Home Sales, % Closed Over List Price
January: 38%
February: 43%
March: 53%
1/2April: 57%
Most sellers and agents are happy just to get 1% to 5% over list. There were only 18 of 173 (10%) that sold for a double-digit percentage over list. The big winners:
Most % Over List Price
List Price
Sales Price
Percentage Over List Price
$969,000
$1,210,000
25%
$1,399,000
$1,700,000
22%
$1,099,000
$1,316,000
20%
$1,425,000
$1,675,000
18%
$3,000,000
$3,500,000
17%
$1,499,000
$1,750,000
17%
$999,000
$1,160,000
16%
NSDCC Sales, April (First Half): 173
(the number of sales was 45% higher than same period in 2019)
Last week I mentioned that because there was a drop-off in pendings, we might have hit peak frenzy. But I didn’t consider the usual spring break lull – we’re right back at it now:
Two Weeks Ago:
Actives: 334
Pendings: 362
Last week:
Actives: 357
Pendings: 344
This Week:
Actives: 335
Pendings: 358
The action under $2,000,000 is phenomenal – look at the NSDCC active-to-pending ratios:
This week we heard the the news that homes.com was acquired:
Homes.com has a similar business model to massive real estate website Zillow, at least as far as Zillow’s core business goes. Homes.com is a property listing portal that helps agents and brokers market properties. The platform supports more than a half-million agents and brokers, and the website receives about 5 million unique visitors each month in the form of buyers searching listings.
For the time being, Homes.com is a much smaller business. Zillow’s real estate platform received more than 200 million unique monthly users in the fourth quarter of 2020 and was visited 2.2 billion times altogether. And Zillow has a rapidly growing business of directly buying and selling homes, while Homes.com is solely a home search platform. What’s more, keep in mind that CoStar is buying Homes.com for $156 million — Zillow’s market cap is about $34 billion.
However, it’s not just Homes.com anymore. Once it’s brought under CoStar’s umbrella, it will join forces with brands like the LoopNet commercial real estate marketplace (an area where Zillow doesn’t operate), Apartments.com, Apartment Finder, and most importantly, the Homesnap real estate agent workflow software business.
Homesnap is another recent acquisition, purchased by CoStar in December 2020. The Homesnap platform offers a marketing platform for agents, and CoStar plans to take advantage of the combination with Homes.com. As CEO Andrew Florance said in the press release announcing the acquisition, “Our plan in bringing Homesnap and Homes.com together is to help agents market their listings in support of the ‘your listing, your lead’ philosophy — which stands in contrast to most players in the industry.”
Can any home-search portal keep up with Zillow? They would need to spend the big bucks on advertising like Zillow does, just to be in the running. Zillow already has the name-brand recognition, a huge lead in monthly visitors, and they have the killer instinct and willingness to spend big on advertising – including key product placement. Displaying their for-sale signs in their ads will further establish them as a national brokerage in the mind of the consumer:
It is unusual to have so few active listings for sale. Yet, we are having more sales than ever, with the quality homes all selling in the first week – leaving very few active listings.
Casual observers don’t find any decent homes just lying around, making it difficult to stay engaged. You gotta really want to buy a house these days, which should help keep the demand in check – it’s just for serious players only.
But there are plenty of those, and we should hit October levels of sales in each of the next few months:
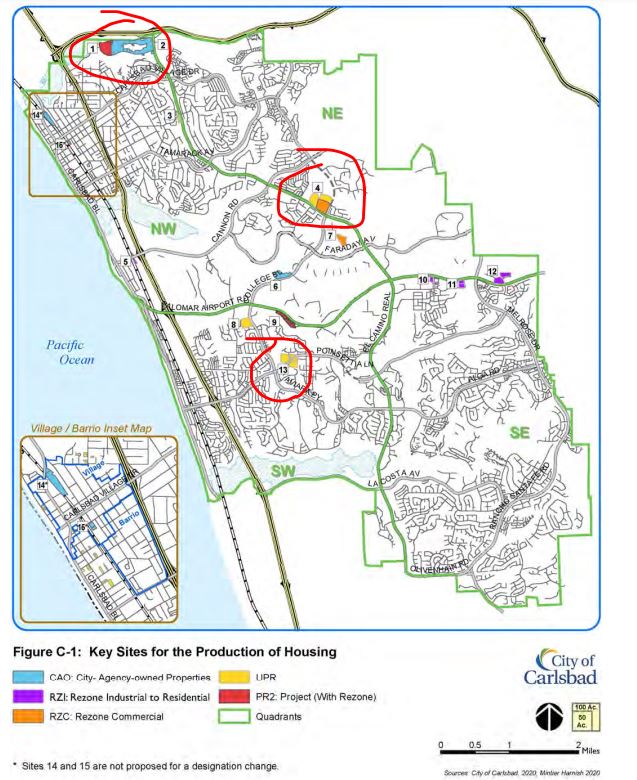
Above is the map produced by the City of Carlsbad to help identify the areas where they can increase production of multi-family units, and try to reach their low-income housing goals.
I circled in red the larger developments:
The owners of the Mall have proposed rezoning their parking lots and adding 993 homes there, plus the neighboring Verizon/Michael’s shopping center has proposed redeveloping it into 242 residential units – a total of 1,235 homes.
The #4 site in the middle was once going to be a WalMart (who owns it), but it never gained traction. A developer from Phoenix has proposed building 474 homes on the 39 acres there.
There are six parcels totaling 21 acres on both sides of Poinsettia at Brigantine. Under the current zoning, 50 homes could be built there, but the developer as applied for upzoning so they can build 327 multi-family units.
If re-zoned, these projects will include NO single-family houses. Because the city is pressed to hit their goals, it looks like most of these units will be restricted to low-to-moderate income residents.
Trustindex verifies that the original source of the review is Google.
We sold a home with Jim and Donna and from beginning to end they were consummate professionals. Their initial walk through the property resulted in a list of items to be repaired or updated. They supplied a list of vendors and job quotes to do the repairs and updates. We originally wanted to sell ‘as is’ and just get it over with. They gave us a selling price for ‘as is’ and options for doing a few updates/repairs to doing it all with the selling price for each option. We agreed to do all they suggested and we sold for the exact price they predicted. For every dollar spent we got back more than $2 back in the selling price. And they got that price in a rising interest rate environment! Donna and Jim are extremely detailed and guide you through ever aspect of the sale. There were no surprises thanks to their guidance. We couldn’t be more pleased with their representation.
Thank you Donna and Jim,
Jerry and Mary
Heather Quejada
March 27, 2025
Trustindex verifies that the original source of the review is Google.
We have known Jim & Donna Klinge for over a dozen years, having met them in Carlsbad where our children went to the same school. As long time North County residents, it was a no- brainer for us to have the Klinges be our eyes and ears for San Diego real estate in general and North County in particular. As my military career caused our family to move all over the country and overseas to Asia, Europe and the Pacific, we trusted Jim and Donna to help keep our house in Carlsbad rented with reliable and respectful tenants for over 10 years.
Naturally, when the time came to sell our beloved Carlsbad home to pursue a rural lifestyle in retirement out of California, we could think of no better team to represent us than Jim and Donna. They immediately went to work to update our house built in 2004 to current-day standards and trends — in 2 short months they transformed it into a literal modern-day masterpiece. We trusted their judgement implicitly and followed 100% of their recommended changes. When our house finally came on the market, there was a blizzard of serious interest, we had multiple offers by the third day and it sold in just 5 days after a frenzied bidding war for 20% above our asking price! The investment we made in upgrades recommended by Jim and Donna yielded a 4-fold return, in the process setting a new high water mark for a house sold in our community.
In our view, there are no better real estate professionals in all of San Diego than Jim and Donna Klinge. Buying or selling, you must run and beg Jim and Donna Klinge to represent you! Our family will never forget Jim, Donna, and their whole team at Compass — we are forever grateful to them.
Lou F
March 27, 2025
Trustindex verifies that the original source of the review is Google.
WeI had the pleasure of working with Klinge Realty Group to sell our home in Carmel Valley, and I cannot recommend them highly enough!
Jim and Donna demonstrated exceptional professionalism, offering expert guidance on market conditions and pricing strategy, which resulted in a quick and successful sale.
Communication was prompt and we were well-informed throughout the entire process.
For anyone looking for a dedicated and knowledgeable real estate team, look no further!
---
William Sams
March 25, 2025
Trustindex verifies that the original source of the review is Google.
Donna and Jim Klinge of Klinge Realty Group have our highest possible recommendation. From Donna and Jim’s first visit to our house through closing their advice and counsel was candid and honest in all dealings. They kept us fully informed throughout the process. The house sold less than three days after listing with a two-week closing. My wife and I have sold several houses during our lives. This was by far the best experience. Klinge Reality is a premium service realtor. You can’t make a better choice for someone to sell your home fast and for top dollar.
Emily Hernandez
December 29, 2024
Trustindex verifies that the original source of the review is Google.
Donna and Jim provided exceptional support and professionalism throughout the entire process. We couldn't have been happier with their efforts. They made our house shine, and thanks to their expertise, it sold above the listing price in the very first weekend! Truly a fantastic experience from start to finish.
Jesus Adrian Sahagun
November 11, 2024
Trustindex verifies that the original source of the review is Google.
This year has been difficult on our family, mainly due to having to sell our home. Thankfully we knew God had a plan for us and working with the Klinge team was a key part of it. It was an obvious decision to work with them again after such an amazing experience when purchasing the same home we needed to sell. The challenge was, how will we do this in so little time with so much going on? Jim and Donna held our hand every step of the way. Whenever an unexpected issue arose they found and provided a solution. Never once did we feel pressured to make a decision and the Klinges were always reassuring after providing the information that the decision was ours to make. Despite the curve balls, they never panicked and exemplified the “can do” attitude, making us feel optimistic and taken care of. Their expertise and professionalism was superb. But of all the reasons to work with the Klinges, the most impactful and valuable is their compassion and genuine care for their clients. We pray that we can one day purchase our forever home and you better believe that Jim and Donna will be representing us - as long as they will have us of course. Thank you again Klinge team! Your execution, experience, and care are unmatched.
SABIHA PASHA
July 23, 2024
Trustindex verifies that the original source of the review is Google.
Jim and Donna were fantastic! Jim understanding my needs, recommending potential places, pointing out the pros and cons of each property was invaluable. Then when the offer was accepted Donna’s organized guidance through the inspections, paperwork etc made the whole process seem effortless.
So grateful that I had them on my side!
Anu Koberg
July 13, 2024
Trustindex verifies that the original source of the review is Google.
We first found Jim through his blog at bubbleinfo.com, which really showcased his knowledge of SoCal real estate. Since then we've done three transactions with Jim and Donna, and they are an incredible full service agency, with Jim's deep market insight and Donna's deft contract and project management. We trust them implicitly in their analysis and strategy, which is based on years of experience. They're always available and on top of things, and we strongly recommend them to anyone.
Bjorn Isachsen
July 10, 2024
Trustindex verifies that the original source of the review is Google.
The Good
The Klinge Realty Group operates like a finely tuned machine, with a very personal touch. We contacted them on a Sunday and they were talking to us about our family and our needs on our living room couch the following day. They carefully listened to us and worked with us to identify the best and quickest path to listing within 2 weeks to take advantage of the low inventory conditions in our South Carlsbad neighborhood. They knew our tract specifically and had many previous sales there over the years - they came prepared with a thorough analysis of comparative sales and recommended a pricing strategy that they felt confident would yield offers the first weekend on the market.
The Great
Over the next two weeks Donna coordinated a range of vendors who she knew from experience could get the preparation to list work we needed done on time and with high quality. Our light tune-up involved excellent experiences with their stagers, landscapers, contractors, electricians, and plumbers. Throughout this period Donna's daily communication was clear, concise, and responsive. Any time we had questions Donna picked up the phone or texted immediately - but almost always, she answered our questions before we even knew we had them.
The Outstanding
We had a tricky situation with a shared fence that could have delayed our escrow. Donna used superb mediation skills to negotiate the terms of replacement and was personally on site with the fence contractor to make sure everything went smoothly. The fence looks great and escrow closed on time.
The Truly Exceptional
Our house came on the market on a Wednesday and between then and Monday morning Jim was personally at all three open houses. He was in constant communication explaining potential buyer reaction and strength. As he predicted offers began to come in on Saturday and each one was incrementally higher than the last. At the end we had 5 offers, 4 of which were over list, and the final accepted offer was $100,000 over list. In addition to being over list it included rent back terms that met our needs.
The Recommendation
For all of these reasons we would strongly recommend The Klinge Team to anyone wanting to sell in North County Coastal San Diego. I had been reading Jim's bubbleinfo.com blog for 15 years and knew when the time came to sell that he would be our first call. Jim Klinge is not your standard realtor. He is keenly aware of market conditions and sales strategies. And, works his tail off - though not as hard as Donna . At this point he's gone from realtor to friend and I plan to have him over to grill and chill at our new place to talk real estate, but also just about life and raising kids in San Diego. He's more interested in relationships than his sales numbers - and that's why his sales numbers are so high. We have already recommended the Klinge's to some close friends and another successful sale is on deck right around the corner...
Chris Shea
June 21, 2024
Trustindex verifies that the original source of the review is Google.
We recently had the pleasure of working with Jim and Donna from Klinge Realty Group to sell our house, and we couldn't be more satisfied with the experience. From the initial meeting, they listened attentively to our needs and provided invaluable guidance on specific improvements to get our home market ready.
Their responsiveness throughout the entire process was truly impressive. Anytime we had questions or concerns, they were quick to address them, ensuring we felt comfortable and informed every step of the way. What stood out the most was their team and extensive network of tradespeople, which made addressing any necessary repairs or updates seamless and stress-free.
Thanks to their expertise and dedication, our house sold quickly and at a great price. We highly recommend Jim and Donna to anyone looking to buy or sell a home. They are a fantastic team who truly care about their clients and deliver exceptional results.