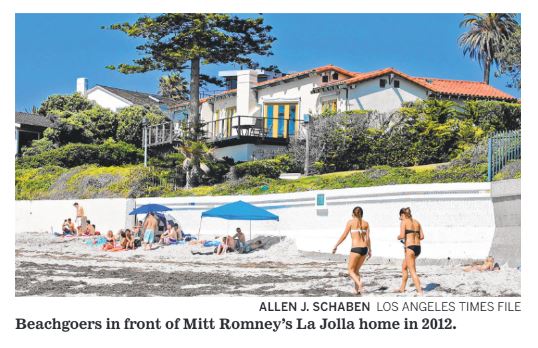
Mitt Romney has sold his oceanfront La Jolla home for $23.5 million. The Utah senator, and former Republican presidential candidate, completed the sale June 30, according to the San Diego County Recorder’s Office.
A small part of American history, the home became an example of what opponents in the 2012 presidential election said was an example of Romney being out of touch as he attempted to build an elevator on the property for his cars. The “car elevator” house was often tied to Romney’s opposition to the bailout of the auto industry during the Great Recession. “The cars get the elevator, the workers get the shaft,” said former Michigan Gov. Jennifer Granholm in one of the most often-quoted speeches from that time.
The sale price makes it the fifth-most expensive home sale in San Diego County history, and the third-most expensive for La Jolla. The biggest purchase in San Diego County history remains the 2007 sale of an oceanfront home in Del Mar for $48.2 million. The same house was later sold to Bill and Melinda Gates for $43 million in April 2020.
The grant deed said the Romney home was sold to William Rastetter, and his wife, Marisa. Rastetter has been a force in San Diego’s biotechnology and venture capital scene for more than three decades. He’s perhaps best known for his 20 years at IDEC Pharmaceuticals, where he served in leadership roles including chief executive, president and director. While there, he was the co-inventor of Rituxan, the first monoclonal antibody cancer treatment approved by the U.S. Food and Drug Administration. IDEC merged with life sciences giant Biogen in 2003 for $6.8 billion.
Rastetter also served as board chairman of gene sequencing giant Illumina for 11 years, and has been a director at myriad other local life sciences firms. They include Neurocrine Biosciences, Regulus Therapeutics, Fate Therapeutics and Receptos, which was acquired by Celgene Corp. in 2015 for $7.2 billion.
Romney and his wife, Ann, purchased the property at 311 Dunemere Drive in 2008 for $12 million. The existing 3,009-square-foot home was torn down to build an 8,153-square-foot mansion with five bedrooms, six bathrooms and 65 feet of ocean frontage. It is one of roughly 30 beachfront homes in La Jolla.
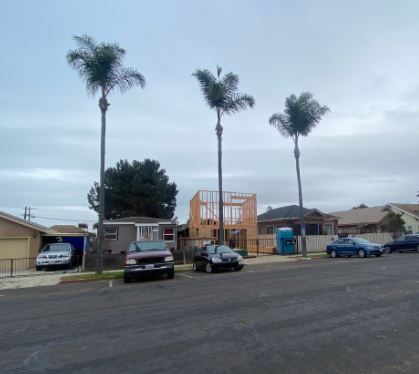
The home was sold off-market, making a photo of the notorious “car elevator” hard to find. A 2020 assessment of the property, valued at $15.3 million, said the four-car garage was completed.
Room for parking in San Diego beach communities is rare. The most expensive La Jolla home sale, $24.7 million at 8466 El Paseo Grande in January, has a two-car garage. Romney’s campaign in 2012 said the lift was necessary to create a four-car garage because he has many children and grandchildren.
Romney revealed he had sold the home in late June in a virtual discussion about infrastructure sponsored by the Salt Lake Chamber, and was first revealed by The Salt Lake Tribune . At the time, his staff declined to discuss the details, including the price.
The San Diego Union-Tribune reported in 2015 that Romney had been considering selling the home near the end of its rebuild. The project was opposed by several neighbors and conservationists for what they said was an out-of-place design in La Jolla.
Romney was not the only well-known person to live at the property. The original home was owned by former San Diego Mayor Maureen O’Connor and her late husband, Bob Peterson, founder of Jack in the Box restaurants.
Mitt Romney recently paid $12 million to buy a home on the ocean in La Jolla, Calif., near San Diego. His son Matt lives in the same area. The former Massachusetts governor, whose main residence is in Belmont, Mass., says he has no plans to become a California resident, and the purchase has nothing to do with a possible future presidential run.
“I’ve always wanted to have a place on the beach where you could hear the crashing waves,” Romney says. “And you know, I’m 61; I’m not going to live forever. I said, ‘Ann, I want to get a place on the beach. I don’t care what size it is, but I want a place on the beach.’ And this spot, it’s not a huge home, it’s 3,000 square feet, but it is right on the beach, and you open the windows and hear the waves crash. It’s heavenly.”
Of the 1,682 NSDCC houses sold this year, the median list price was $1,800,000, the median sales price was $1,850,050, and the median days on market was 12.
An excerpt from the UT article linked below – the lack of homes for sale is stunning:
If you look at the overall number of homes for sale in San Diego County, it is still at historic lows. There were 3,990 homes for sale from May 24 to June 20. That is below even 2020 with stay-at-home orders in place when there were around 6,260 at the same time. The same goes for 2019 with 8,561 homes listed; 2018 with 8,064 and 7,185 in 2017.
So, while there have been more new listings in recent weeks, they have been selling so fast that inventory totals don’t have the chance to grow. For instance, around this time last year, about half of homes were selling in two weeks or less (compared with more than 70 percent now). That meant a home that went on the market in May might still be there in June or July — whereas now there is no buildup in supply because new listings are snatched up so rapidly.
The Covid Frenzy has had remarkable shift in market efficiency like we have never seen.
Historically, we have had so many listings that 35% to 40% of them didn’t sell.
This year we had 977 listings hit the market in 1Q21, and 80% of them have already closed escrow! Of the remaining listings that haven’t sold, two-thirds of them were cancelled, withdrawn, or expired which usually means that the sellers either changed their mind or refreshed their listings. Of the 977 listings, only 47 of them remain as active (unsold) listings, with a median list price of $6,900,000!
Yet, the extremely active marketplace isn’t causing more people to sell.
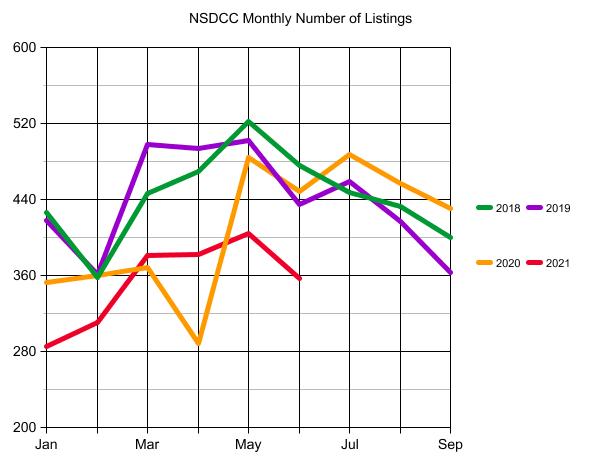
The total number of 2021 listings is 8% behind the covid-impacted 2020!
NSDCC Listings and Sales
Month
2018
2019
2020
2021
2021 L/S
Jan
426/149
418/150
353/182
285/187
1.52
Feb
358/162
361/174
360/184
311/224
1.39
Mar
446/258
498/211
368/206
381/252
1.51
Apr
469/270
494/265
288/156
382/357
1.07
May
522/273
502/297
484/143
404/301
1.34
Jun
476/299
435/282
448/274
357/340
1.05
1H Totals
2,697/1,411
2,708/1,379
2,301/1,145
2,120/1,661
List/Sales
1.91
1.96
2.01
1.28
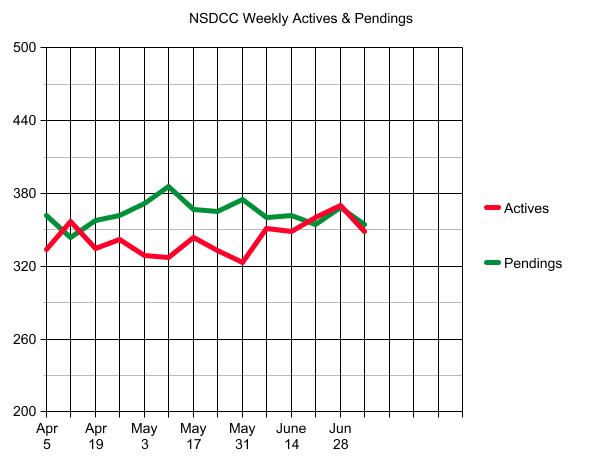
There were 357 new listings last month, and 340 sales?!?! The lack of inventory or the rapidly-rising prices aren’t slowing down sales! If only there were more houses to sell under $2,000,000!
If sales were to retreat, it would seem obvious that it would be due to the lack of supply. There have been more losers of bidding wars than winners, and that demand has yet to be satisfied.
But we are going to hear more doomer talk in the media. Here we have Larry predicting that more homes will be listed in the latter half of 2021 – which would cause MORE sales – yet check the headline:
An excerpt:
What happened: All regions saw an uptick in pending sales, led by a 15.5% surge in the Northeast. The South saw the smallest increase, with a 4.9% uptick.
The big picture: The uptick in pending sales could be sustained, Yun argued, because of the strong stock market and rising home prices. He predicted that more homes will be listed in the latter half of the year, which would help to slow the pace of home-price growth.
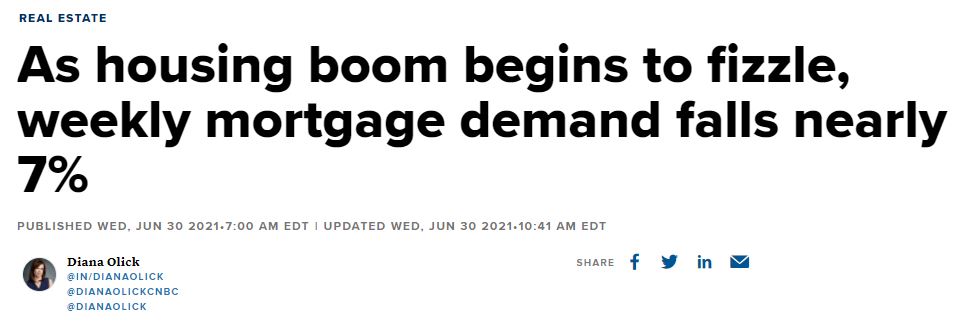
Still, economists generally anticipate that the second half of 2021 will see a slowdown in real-estate transactions. To get an idea of where home sales are headed, look no further than the data for mortgage applications.
“Sales lag mortgage applications, and the 26% plunge in the latter between December and April is now working its way through the sales numbers,” Ian Shepherdson, chief economist at Pantheon Macroeconomics, wrote in a research note. He went on to argue that “sales will soon hit bottom, given the flattening in mortgage demand over the past couple months.”
The latest mortgage-applications data from the Mortgage Bankers Association would back up that prediction. The trade group’s index that measures the volume of applications for loans used to purchase homes was down 17% from a year ago as of the week ending June 25, and had declined 6% from the previous week.
Hit bottom? Bottom of what?
The ‘26% plunge’ in mortgage applications between December and April didn’t slow sales – they are higher in every market. But determined to find some doom, he surmises that the lower number of purchase applications will catch up to sales some day?
It doesn’t occur to the ivory-tower types that the market was going ballistic last summer, and this week’s mortgage apps being 17% lower than last year is not alarming. We had 350 NSDCC sales last August, and another 361 sales in September – both record highs!
Yet the media publishes this garbage without a thought. They could unwittingly cause a slowdown just when more homes might be coming to market – which would goose sales higher, not lower.
For the last year, real estate has been hot around the world. When California gets cooking, so do all the neighboring states. And when America gets cooking, other markets around the world benefit too.
There are varying degrees of hot, but we can say that real estate markets everywhere have been operating at their peak capacity.
We’ve had a year of full-tilt frenzy and sales were SPECTACULAR!
But yesterday we got the first headline from Doomer Diana that should be a marker:
Thankfully, not many people will read her article where she states that higher prices and rates are the cause of the ‘fizzle’, which is a knee-jerk reaction. She and others will blame the buyers for any slowdown.
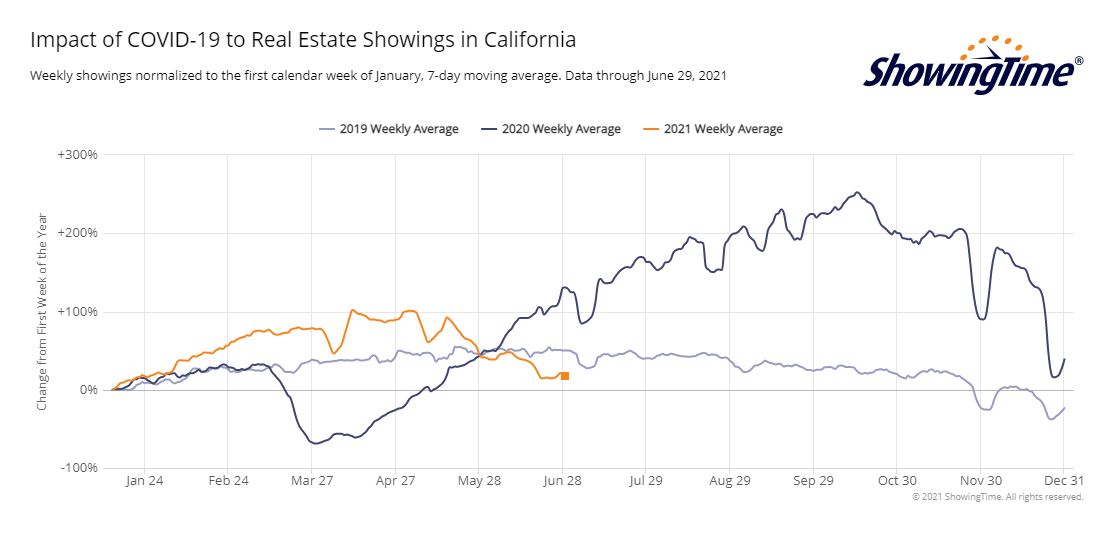
Good thing she didn’t see the the graph at the top that has showings lower than in June, 2019, and you remember how that ended (the San Diego Case-Shiller flat-lined for the second half of 2019).
It will be common to blame the buyers. But for the first time ever, our real estate market is having a critical shortage of homes for sale when the demand is exceedingly high. There were 500 people who visited a $1,700,000 Carmel Valley house over the weekend. Demand is not our problem, it is the lack of supply.
Trustindex verifies that the original source of the review is Google.
We sold a home with Jim and Donna and from beginning to end they were consummate professionals. Their initial walk through the property resulted in a list of items to be repaired or updated. They supplied a list of vendors and job quotes to do the repairs and updates. We originally wanted to sell ‘as is’ and just get it over with. They gave us a selling price for ‘as is’ and options for doing a few updates/repairs to doing it all with the selling price for each option. We agreed to do all they suggested and we sold for the exact price they predicted. For every dollar spent we got back more than $2 back in the selling price. And they got that price in a rising interest rate environment! Donna and Jim are extremely detailed and guide you through ever aspect of the sale. There were no surprises thanks to their guidance. We couldn’t be more pleased with their representation.
Thank you Donna and Jim,
Jerry and Mary
Heather Quejada
March 27, 2025
Trustindex verifies that the original source of the review is Google.
We have known Jim & Donna Klinge for over a dozen years, having met them in Carlsbad where our children went to the same school. As long time North County residents, it was a no- brainer for us to have the Klinges be our eyes and ears for San Diego real estate in general and North County in particular. As my military career caused our family to move all over the country and overseas to Asia, Europe and the Pacific, we trusted Jim and Donna to help keep our house in Carlsbad rented with reliable and respectful tenants for over 10 years.
Naturally, when the time came to sell our beloved Carlsbad home to pursue a rural lifestyle in retirement out of California, we could think of no better team to represent us than Jim and Donna. They immediately went to work to update our house built in 2004 to current-day standards and trends — in 2 short months they transformed it into a literal modern-day masterpiece. We trusted their judgement implicitly and followed 100% of their recommended changes. When our house finally came on the market, there was a blizzard of serious interest, we had multiple offers by the third day and it sold in just 5 days after a frenzied bidding war for 20% above our asking price! The investment we made in upgrades recommended by Jim and Donna yielded a 4-fold return, in the process setting a new high water mark for a house sold in our community.
In our view, there are no better real estate professionals in all of San Diego than Jim and Donna Klinge. Buying or selling, you must run and beg Jim and Donna Klinge to represent you! Our family will never forget Jim, Donna, and their whole team at Compass — we are forever grateful to them.
Lou F
March 27, 2025
Trustindex verifies that the original source of the review is Google.
WeI had the pleasure of working with Klinge Realty Group to sell our home in Carmel Valley, and I cannot recommend them highly enough!
Jim and Donna demonstrated exceptional professionalism, offering expert guidance on market conditions and pricing strategy, which resulted in a quick and successful sale.
Communication was prompt and we were well-informed throughout the entire process.
For anyone looking for a dedicated and knowledgeable real estate team, look no further!
---
William Sams
March 25, 2025
Trustindex verifies that the original source of the review is Google.
Donna and Jim Klinge of Klinge Realty Group have our highest possible recommendation. From Donna and Jim’s first visit to our house through closing their advice and counsel was candid and honest in all dealings. They kept us fully informed throughout the process. The house sold less than three days after listing with a two-week closing. My wife and I have sold several houses during our lives. This was by far the best experience. Klinge Reality is a premium service realtor. You can’t make a better choice for someone to sell your home fast and for top dollar.
Emily Hernandez
December 29, 2024
Trustindex verifies that the original source of the review is Google.
Donna and Jim provided exceptional support and professionalism throughout the entire process. We couldn't have been happier with their efforts. They made our house shine, and thanks to their expertise, it sold above the listing price in the very first weekend! Truly a fantastic experience from start to finish.
Jesus Adrian Sahagun
November 11, 2024
Trustindex verifies that the original source of the review is Google.
This year has been difficult on our family, mainly due to having to sell our home. Thankfully we knew God had a plan for us and working with the Klinge team was a key part of it. It was an obvious decision to work with them again after such an amazing experience when purchasing the same home we needed to sell. The challenge was, how will we do this in so little time with so much going on? Jim and Donna held our hand every step of the way. Whenever an unexpected issue arose they found and provided a solution. Never once did we feel pressured to make a decision and the Klinges were always reassuring after providing the information that the decision was ours to make. Despite the curve balls, they never panicked and exemplified the “can do” attitude, making us feel optimistic and taken care of. Their expertise and professionalism was superb. But of all the reasons to work with the Klinges, the most impactful and valuable is their compassion and genuine care for their clients. We pray that we can one day purchase our forever home and you better believe that Jim and Donna will be representing us - as long as they will have us of course. Thank you again Klinge team! Your execution, experience, and care are unmatched.
SABIHA PASHA
July 23, 2024
Trustindex verifies that the original source of the review is Google.
Jim and Donna were fantastic! Jim understanding my needs, recommending potential places, pointing out the pros and cons of each property was invaluable. Then when the offer was accepted Donna’s organized guidance through the inspections, paperwork etc made the whole process seem effortless.
So grateful that I had them on my side!
Anu Koberg
July 13, 2024
Trustindex verifies that the original source of the review is Google.
We first found Jim through his blog at bubbleinfo.com, which really showcased his knowledge of SoCal real estate. Since then we've done three transactions with Jim and Donna, and they are an incredible full service agency, with Jim's deep market insight and Donna's deft contract and project management. We trust them implicitly in their analysis and strategy, which is based on years of experience. They're always available and on top of things, and we strongly recommend them to anyone.
Bjorn Isachsen
July 10, 2024
Trustindex verifies that the original source of the review is Google.
The Good
The Klinge Realty Group operates like a finely tuned machine, with a very personal touch. We contacted them on a Sunday and they were talking to us about our family and our needs on our living room couch the following day. They carefully listened to us and worked with us to identify the best and quickest path to listing within 2 weeks to take advantage of the low inventory conditions in our South Carlsbad neighborhood. They knew our tract specifically and had many previous sales there over the years - they came prepared with a thorough analysis of comparative sales and recommended a pricing strategy that they felt confident would yield offers the first weekend on the market.
The Great
Over the next two weeks Donna coordinated a range of vendors who she knew from experience could get the preparation to list work we needed done on time and with high quality. Our light tune-up involved excellent experiences with their stagers, landscapers, contractors, electricians, and plumbers. Throughout this period Donna's daily communication was clear, concise, and responsive. Any time we had questions Donna picked up the phone or texted immediately - but almost always, she answered our questions before we even knew we had them.
The Outstanding
We had a tricky situation with a shared fence that could have delayed our escrow. Donna used superb mediation skills to negotiate the terms of replacement and was personally on site with the fence contractor to make sure everything went smoothly. The fence looks great and escrow closed on time.
The Truly Exceptional
Our house came on the market on a Wednesday and between then and Monday morning Jim was personally at all three open houses. He was in constant communication explaining potential buyer reaction and strength. As he predicted offers began to come in on Saturday and each one was incrementally higher than the last. At the end we had 5 offers, 4 of which were over list, and the final accepted offer was $100,000 over list. In addition to being over list it included rent back terms that met our needs.
The Recommendation
For all of these reasons we would strongly recommend The Klinge Team to anyone wanting to sell in North County Coastal San Diego. I had been reading Jim's bubbleinfo.com blog for 15 years and knew when the time came to sell that he would be our first call. Jim Klinge is not your standard realtor. He is keenly aware of market conditions and sales strategies. And, works his tail off - though not as hard as Donna . At this point he's gone from realtor to friend and I plan to have him over to grill and chill at our new place to talk real estate, but also just about life and raising kids in San Diego. He's more interested in relationships than his sales numbers - and that's why his sales numbers are so high. We have already recommended the Klinge's to some close friends and another successful sale is on deck right around the corner...
Chris Shea
June 21, 2024
Trustindex verifies that the original source of the review is Google.
We recently had the pleasure of working with Jim and Donna from Klinge Realty Group to sell our house, and we couldn't be more satisfied with the experience. From the initial meeting, they listened attentively to our needs and provided invaluable guidance on specific improvements to get our home market ready.
Their responsiveness throughout the entire process was truly impressive. Anytime we had questions or concerns, they were quick to address them, ensuring we felt comfortable and informed every step of the way. What stood out the most was their team and extensive network of tradespeople, which made addressing any necessary repairs or updates seamless and stress-free.
Thanks to their expertise and dedication, our house sold quickly and at a great price. We highly recommend Jim and Donna to anyone looking to buy or sell a home. They are a fantastic team who truly care about their clients and deliver exceptional results.