Rest of 2022
It doesn’t do any good to lower your price if there are no buyers. Sellers of superior homes should wait it out and take their chances later….because the next selling season is right around the corner.

It doesn’t do any good to lower your price if there are no buyers. Sellers of superior homes should wait it out and take their chances later….because the next selling season is right around the corner.
Our full-price buyers backed out of their purchase of my new listing in La Costa Oaks due to fear of fire. I was there in 1997 when the last fire blew through La Costa – you may remember me being interviewed by Susan Taylor on NBS that night – so I’m aware of the danger.
While my listing is in the fire zone, but let’s look at it realistically. For this house to catch fire, the new houses in front would have to burn first, and the fire would have to overwhelm the excellent fire-fighting techniques employed by the best fire crew around who are well-prepared for wildfires and would arrive on scene before this house get touched.
You could also get hit by an asteroid, but do you look up at the sky all day? No – go get fire insurance and enjoy life. The California Fair Plan is the last resort for fire insurance and they will always be there for you.
As a result, we’ll be doing open house tomorrow 12-3, come on by!
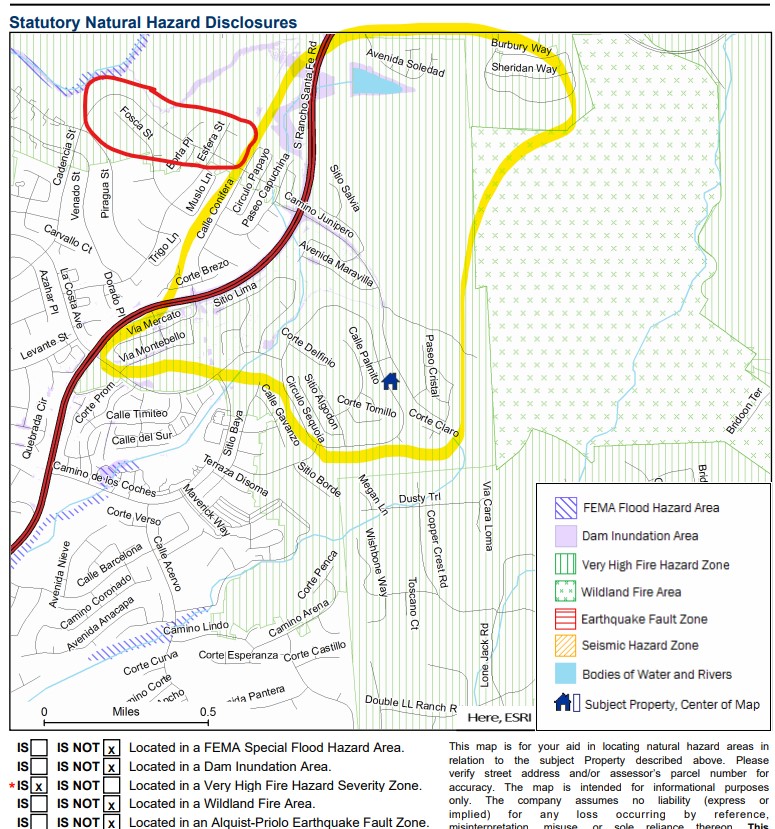
Here is the Natural Hazard Zone Disclosure map – there are hundreds of homes included in the very high fire hazard zone, yet the risk of burning down is extremely unlikely for the vast majority. Where homes burned in the 1996 fire is circled in red, and all of the homes within the yellow border have been built since:
Yesterday I joined Molly of Real Talk Media for a couple of thoughts about next year’s market:
The key to market conditions will be the inventory – no surprise there.
If there was a surge of newer McMansions for sale that were upgraded, well-presented, and had decent backyards, it would light the market on fire, mostly because we haven’t had many of those.
But it is more likely that we will have more of what we’ve had lately – homes for sale that are of the scratch-and-dent variety. They are ok, but not the premium creampuffs that every buyer desires.
The higher-end market will probably struggle a bit as sellers and agents slip back into the old normal where they ‘list ’em high and let them ride’, believing that it takes months to sell a more-expensive home. It doesn’t, but if you don’t have to sell, have plenty of time, and you’re not going to give it away, it is a fine strategy. Call Opendoor and see what they say.
There will be fewer realtors overall, and hardly anyone working with buyers – it’s too hard, and too time-consuming. With less good help, the price will really need to be right for buyers to proceed on their own.
Pricing? We don’t have a good way to measure, just bad ways. The median sales price will probably trend downward due to fewer of the higher-end sales. But sales of the sub-$3,000,000 creampuffs between La Jolla and Carlsbad will determine whether the median sales price goes up or down.
Whoever advertises the most, wins the game. I know agents who spend $25,000 to $50,000 per month!
Aug. 4, 2022- Zillow, Inc. and Opendoor Technologies Inc. have announced a multi-year partnership that combines two category leaders to transform how people start their move. The partnership will allow home sellers on the Zillow platform to seamlessly request an Opendoor offer to sell their home.
Selling a home can be full of uncertainty for many consumers who would rather focus on their next chapter than on the stresses of moving. Potential sellers on Zillow apps and sites may request and view an offer directly from Opendoor and easily compare it to an open-market sale using a real estate agent. Opendoor offers will be available on Zillow, and customers will be able to use the service as a standalone offering or package it with other Zillow home shopping services such as financing, closing and agent selection. Additionally, Zillow customers will be able to work with a licensed Zillow advisor who will serve as a helpful guide in understanding these options.
“Zillow is the most visited brand in online real estate. As we bring the housing super app to life, we’re empowering our millions of visitors to understand all their options and transact in the way that best meets their housing needs,” said Zillow Chief Operating Officer, Jeremy Wacksman. “We know choice is important for customers and they can make the best decision when they see all of their selling options up front — including selling on the open market with a Zillow Premier Agent partner and getting a cash offer from Opendoor. This exclusive partnership will pair Zillow’s audience and brand power with Opendoor’s selling solution in one easy place, so customers can evaluate their selling options and easily package it with other Zillow services to buy and finance their next home.”
“At Opendoor, we’re working to turn what is often viewed as one of life’s most stressful moments — the home move — into an e-commerce experience that’s simple, certain and fast. By bringing together Zillow’s market-leading audience and Opendoor’s e-commerce platform, more consumers will have the option to sell to Opendoor and save themselves the stress and uncertainty of a traditional sale process,” said Opendoor President Andrew Low Ah Kee. “For parents looking to upsize, a young professional moving for a new job, and millions of others who regularly use Zillow to explore their home selling options, we will provide them with the ability to move with a tap of a button.”
Zillow and Opendoor are working together to launch this new product experience with the goal of serving shared customers nationwide in the coming months and years.
The MLS company in Washington state is looking to help with the transition of how buyer-agents get paid. I’m not sure the agents appreciate it though! Could this help sellers see that paying a bounty to buyer-agents would incentivize a sale?
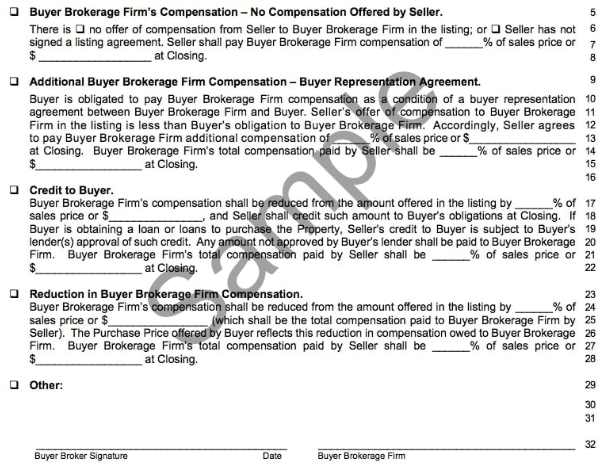
The NWMLS, with its 32,000 subscribers, is changing “its rules and its transaction forms in a bid to boost transparency regarding agent compensation, offer buyers and sellers more options regarding compensation, and encourage innovation in brokerage models.”
That means that “when offered, compensation to the buyer broker will come from the seller directly” rather than the longstanding policy of the listing broker sharing a portion of the commission back with the buyer broker. The changes go into effect on October 3rd.
After that date, NWMLS’s new residential purchase and sale agreement will specify “that the seller may offer no compensation to the buyer brokerage firm, may offer additional compensation in order to meet the buyer’s obligation per a buyer representation agreement, may offer a credit to the buyer, may reduce the compensation offered in the listing, or may offer an alternative to either of those options.”
There will be a few more late-reporters, but it looks like this year’s July sales will be about half of what they were last year:
NSDCC (La Jolla to Carlsbad) July Sales
| Year | |||
| 2016 | |||
| 2017 | |||
| 2018 | |||
| 2019 | |||
| 2020 | |||
| 2021 | |||
| 2022 |
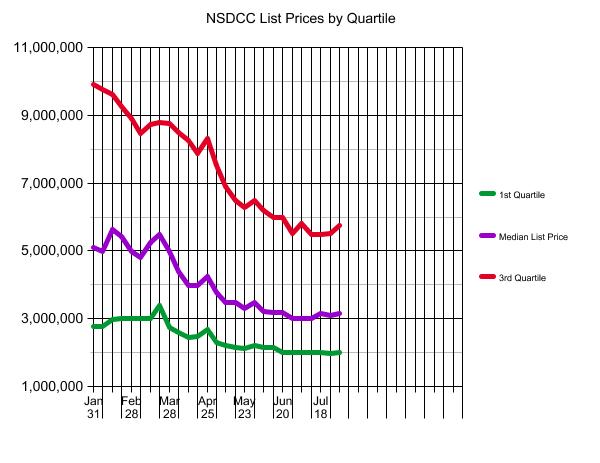
The median sales price was 3% lower than it was in June, but 22% higher than it was last July. A median-priced anything doesn’t give us specific data – it’s only a vague trendline – but it suggests that the higher-priced homes are having more of a struggle finding a buyer.
The declining number of sales does tell us that most sellers are holding out on price (there are 463 active listings with a median list price of $2,999,000). If they are going to sell this year, they need to adjust their price in the next week or two!
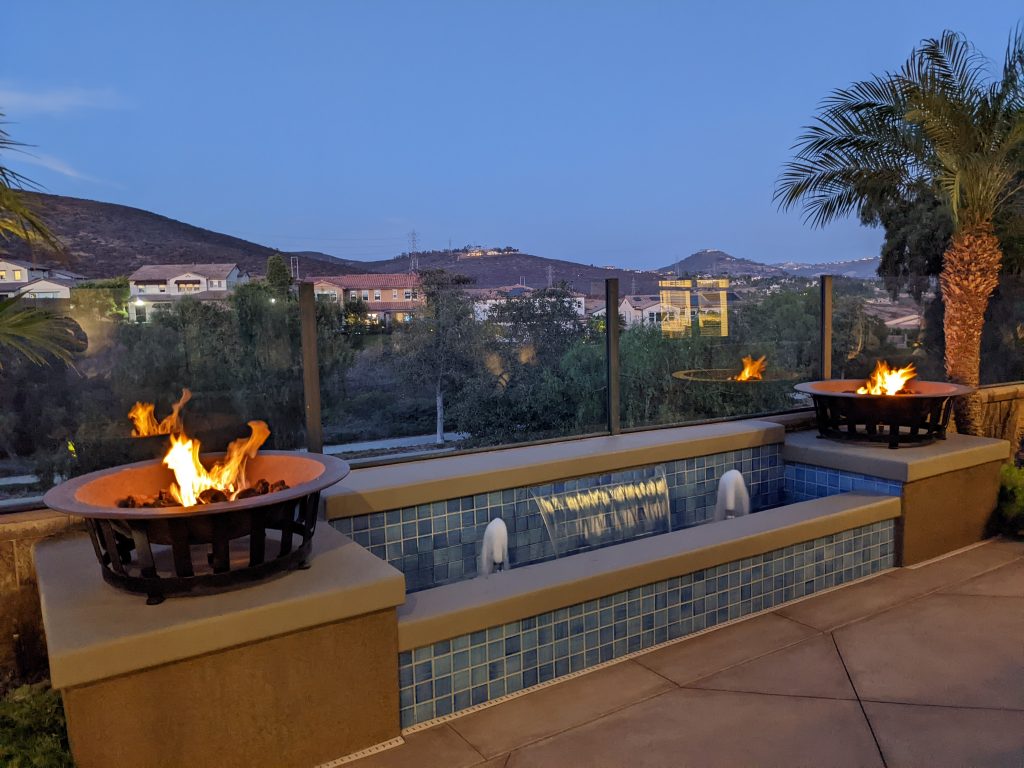
I’ll keep this photo handy!

This sold for $4,488,000 after 76 days on the market, which was $400,000 under the original list price (and $100,000 under the list price at time of sale). It is the second highest-priced sale ever of an attached home on the beach in Carlsbad!
The July stats have been updated on these interactive graphs of the 92009 (SE Carlsbad), 92024 (Encinitas), and 92130 (Carmel Valley) markets:
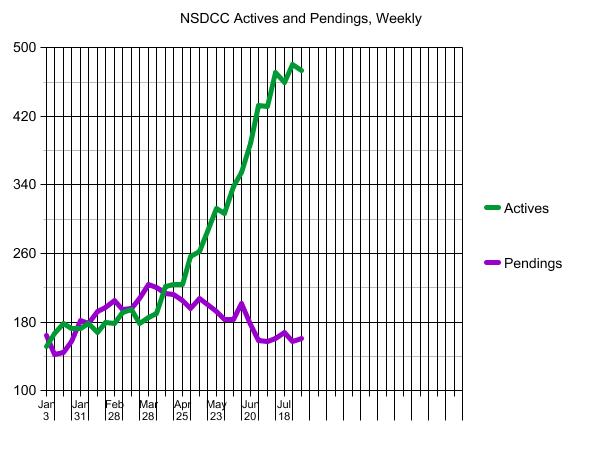
We hear how the inventory has exploded, but compare it to history:
Sales during the 2022 selling season have been similar to February/March numbers:
It’s good to see the insane-bidding-over-the-list-price has slowed:
We’ve pulled forward about ten years’ worth of appreciation – sellers will be reluctant to give it back:
There are still some head-scratchers out there.
This just closed on Friday for $3,400,000 – which was $10,000 over list – but it looks like a fixer inside and out compared to the only other Bressi Ranch house to sell above $3,000,000:
Even if there was a concerted effort to inform the public that mortgage rates are in the 4s (with jumbos in the mid-4s!), it is probably too late in the season to revive much enthusiasm with home buyers.
But there are still people in the hunt. Last week’s count of new pendings was 20, and this week it was 35!
~~~~~~~~~~~~~~~~~~~~~~~~~~~~~~~~~~~


