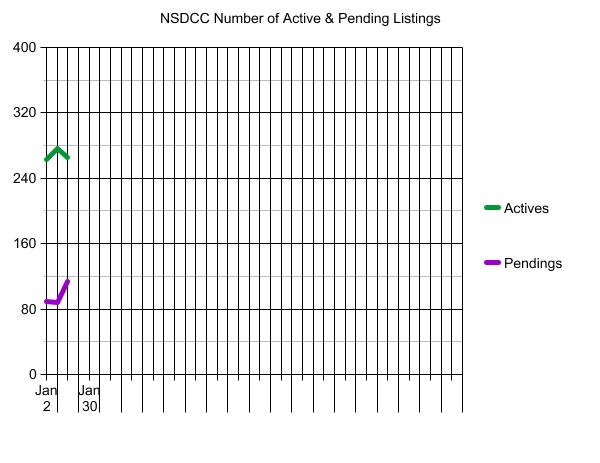
In the last week, there were 36 new listings and 34 new pendings! In the previous week, we also had 36 new listings but only 15 new pendings.
The total pendings count increased +30% in a week!
In the Under-$3,000,000 market, there are 119 actives and 86 pendings, which looks remarkably healthy.
We are about halfway through January, and there have been 80 new listings so far between La Jolla and Carlsbad. It means our contest should wind up around 160-170 listings.
I checked my written count and I had 21 people in the first hour so Sunday’s total was more like 40 visitors. To have almost 100 people visit an open house this early in the year while raining both days is remarkable!
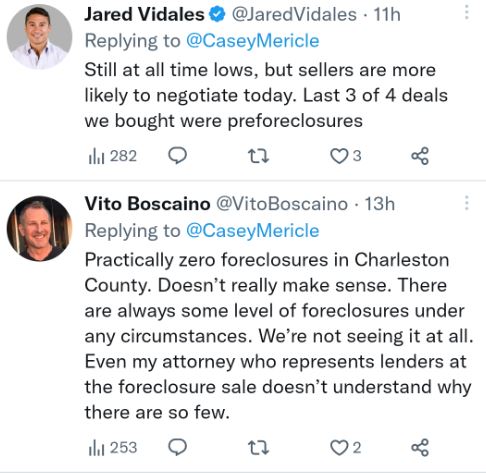
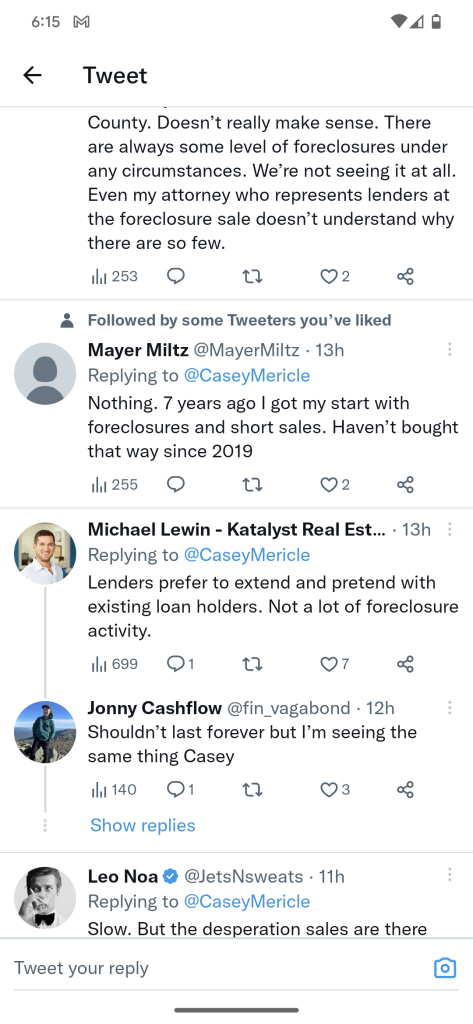
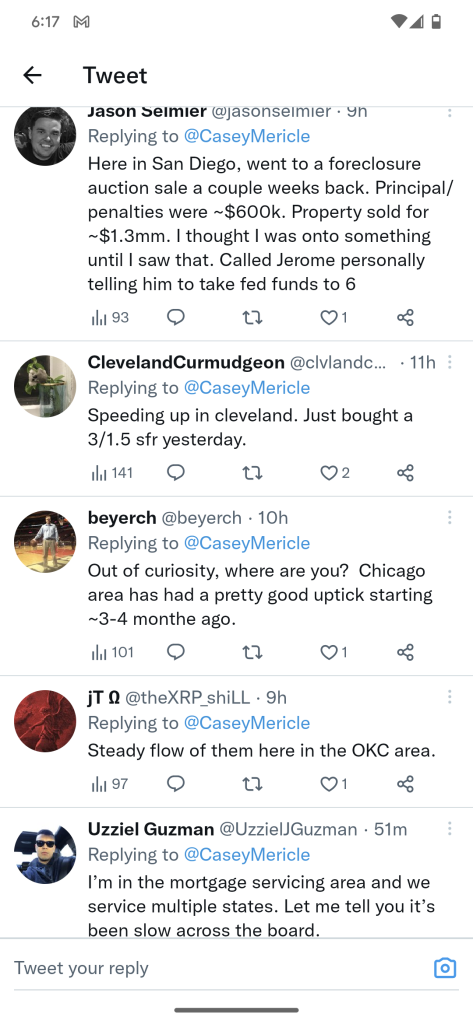
Have you noticed that the doomers are just speculating that the market is bad, mostly based on the median sales price? Is that all you got? Believe what you hear from the street.
The doomers living in mom’s basement want you to believe that the sky is falling.
They’ve never owned a house before, let alone sell real estate for years. Yet, their voice is loud enough that they are winning the battle of opinions about where the market is going – mostly because the entire realtor industry is just standing quietly on the sidelines, instead of providing guidance.
There is one simple correction underway.
The gap is back!
The difference between the fixers and the creampuffs is back, and it is growing, thankfully. The homes that aren’t spruced up are getting hammered on price. It’s probably not that obvious yet because they are the listings that are just lying around not selling. But once they have been on the market for 2-3 months, they are going to get lowballed – and by then, there isn’t much the seller or listing agent can do.
Take your pick. Sell early, or sell low.
The doomers are living in your head now. They don’t take the time to dive deep into the results, or look at an open house. They just group all sales into the same bucket, check the median sales price or the Case-Shiller Index, and declare bloodbath because those too-simple measurements are down a couple of ticks.
It causes buyers to wait for the creampuffs, and ignore the fixers – or lowball them.
I made this observation in the original Coffee Bet in 2006. It was more dramatic and easier to spot back then because the banks didn’t have a problem giving away the dumps, and the downdraft was swift and certain. But these days, the sellers – all loaded with equity – are much more likely to hold out. They saw fixers selling for ridiculous prices during the frenzy, and want to believe that will still happen. But it’s the only change we need to throw the market into tumult, because nobody points out the gap.
Expect that there will be few superior properties for sale, and they’ll sell for a premium. And the rest won’t.
It would be nice if local realtors would adopt this sentiment, and publicize it.
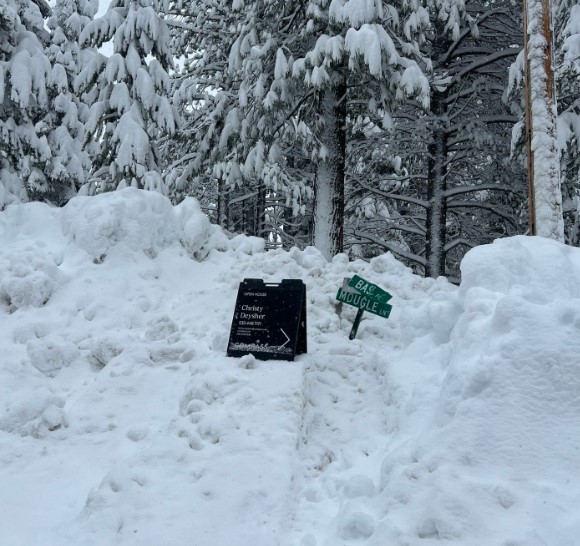
We have buyers who found a home they would like to purchase….but they need to sell their house to make the deal. We scrambled to get it prepared, and we were ready to hit the open market this weekend – but the forecast is for more rain.
Normally, we would wait until the following weekend.
But the listing agent of the house they want to buy said there has been a renewed uptick in activity this week (it’s been an active listing for three months), and yesterday they received a non-contingent offer. Thankfully it was lower.
With the Fed threatening to raise rates higher, he and his seller agreed that this could be their moment. Instead of trying to come to terms with the existing offer, they are going to do open house in the rain this weekend to see if there are any other contenders.
So we will submit our contingent offer today, and do open house this weekend too!
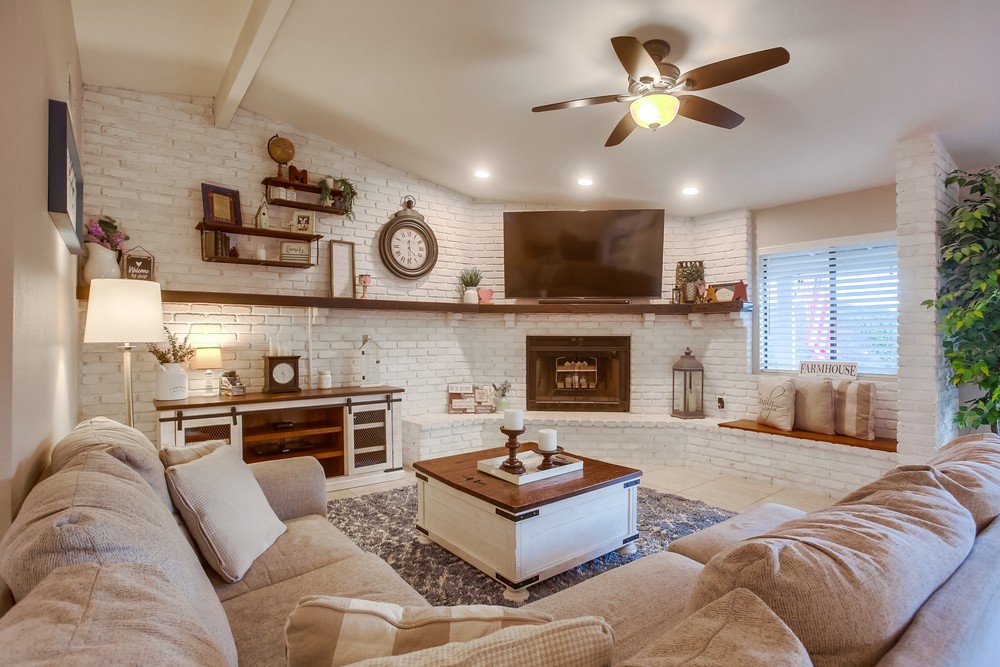
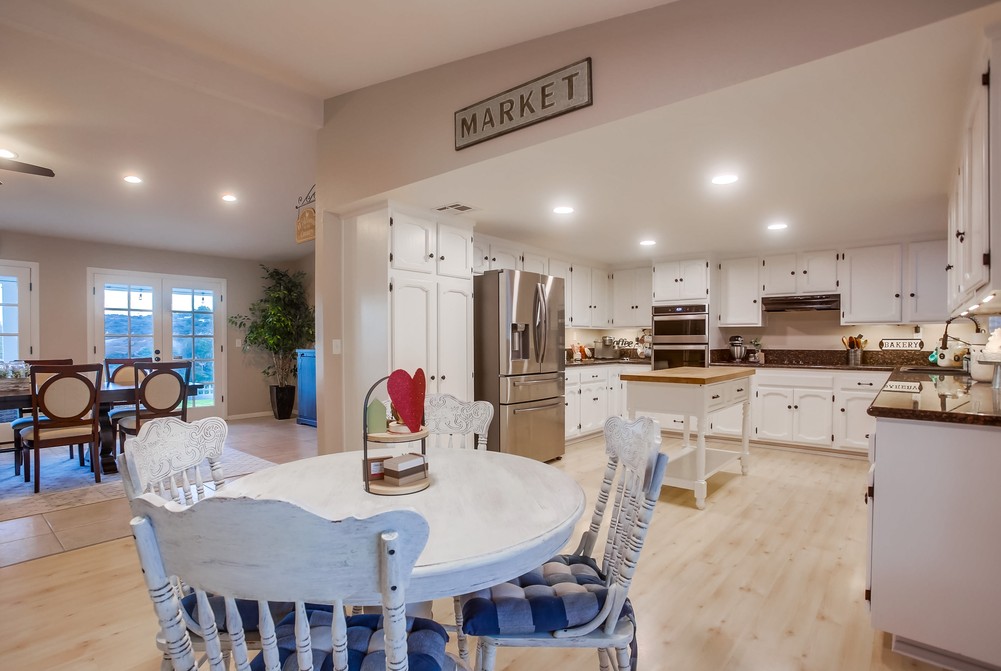
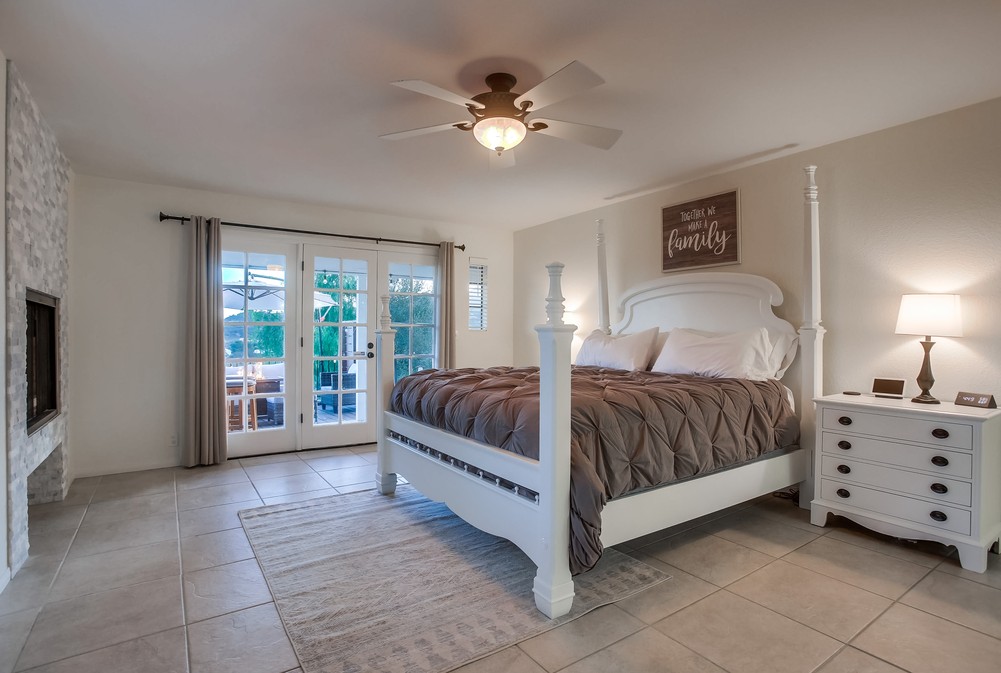
Our listing is perfect for the extended family who want to live the good life in the country!
16390 Whispering Oaks Drive, West Ramona
6 br/4 ba, 3,801sf
YB: 1984
2.35 acres
Gated Community
Full Solar
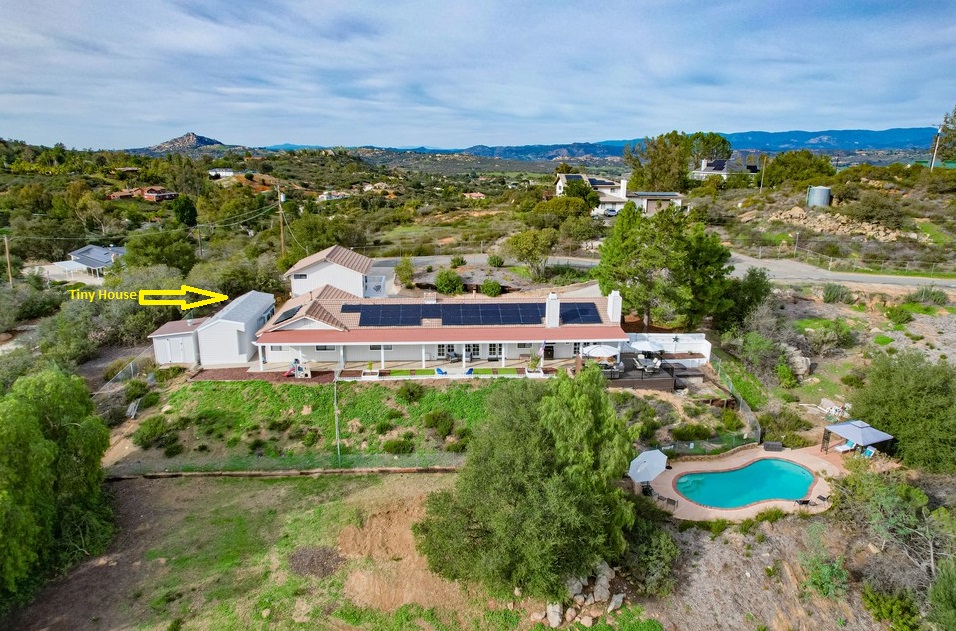
Get away from it all and move to the country! Bring everyone with you too! This 4br/2ba one-story house has newer kitchen and baths, full solar, pool, views of the hills, circular driveway with lots of parking (RVs!), plus TWO ADUs – including a new tiny house – all on 2.35 acres! Total of 6 bedrooms and 4 full bathrooms – perfect for multi-gen! Gated community on the west end and only 3.5 miles from Poway Road.
LP = $1,250,000!
This is the west end of Ramona, just 3.5 miles from Poway Rd!
Another devastating loss for rockers everywhere – Jeff Beck, one of the most skilled, admired and influential guitarists in rock history, died on Tuesday of bacterial meningitis in a hospital near his home at Riverhall, a rural estate in southern England. He was 78.
In high school, I had two of his albums on 8-track – they were part of my teenage soundtrack:
“Jeff Beck is the best guitar player on the planet,” Joe Perry, the lead guitarist of Aerosmith, told The New York Times in 2010. “He is head, hands and feet above all the rest of us, with the kind of talent that appears only once every generation or two.”
First of all, the calendar was perfectly set up for an extended holiday vacation and for everyone to not come back to work until this week. Mortgage rates are double what they were a year ago so nobody can afford a house, plus it’s been raining cats and dogs.
It would be natural to assume that the real estate market is ‘frozen’, and at best we will have a sluggish start.
Yet the early action between La Jolla and Carlsbad has been sizzling:
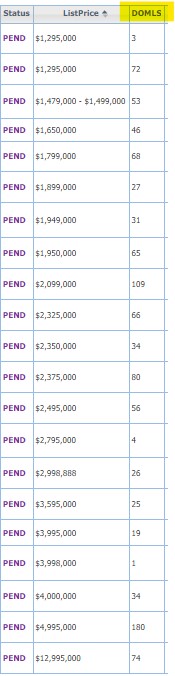
NSDCC Listings Marked Pending Since Jan. 1st:
What is impressive is how long these listings have been on the market – the median DOM is 55 days! Wouldn’t buyers lay off those for a few weeks to see where this is going?
Did the sellers dump on price?
Why would they dump on price with the selling season is right around the corner? Surely they would let it run at least 2-3 weeks into January before giving it away, wouldn’t they?
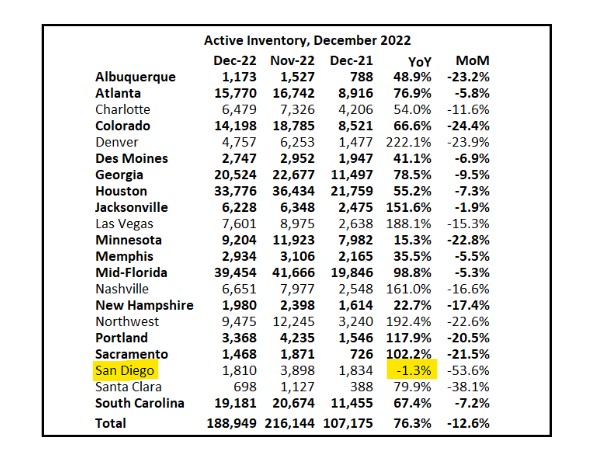
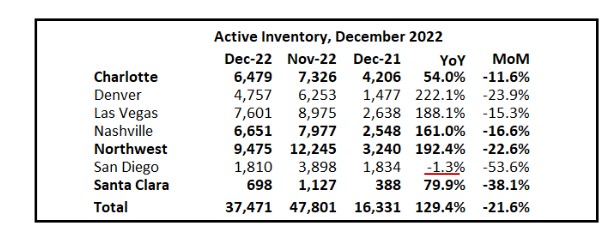
Inventory has exploded everywhere…..except San Diego, and look at the MoM drop. The number of homes for sale last month was cut in half – down to 1,810 active listings in a county of 3.3 million people!
The inventory crisis is likely to continue, and keep pricing elevated.
How does the current environment compare to previous years? IT DOESN’T – we’ve never seen anything like this. Here are the annual stats including a couple of early years for perspective:
San Diego County Detached Homes, Annual
Year
Number of Listings
Median List Price
Number of $2M+ Listings
% of Total
2003
34,229
$449,876
311
0.9%
2009
34,172
$410,000
261
0.8%
2015
35,318
$579,000
653
1.8%
2016
35,806
$600,000
693
1.9%
2017
33,547
$640,000
818
2.4%
2018
35,570
$675,000
895
2.5%
2019
33,352
$695,000
880
2.6%
2020
29,524
$749,000
1,239
4.2%
2021
28,587
$849,000
2,194
7.7%
2022
25,025
$949,900
2,030
8.1%
San Diego County had been listing 33,000 to 35,000 homes for sale every year for decades. Now we’re down to 25,000 annually….or less?
The media will keep publishing national stories about exploding inventory and plummeting prices which will only scare off many potential sellers – and they only need to hear it once or twice before postponing their plans to some indefinite date in the future. If you thought it was a ‘bad time’ to sell, wouldn’t you?
But when is the best time to sell your house?
When everyone else isn’t!
Today there are only 1,761 houses for sale countywide, and the median list price is $1,099,000!
Statistically, it sounds like a good time to sell.
Trustindex verifies that the original source of the review is Google.
A+ thank you
Lisa Tuomi
June 11, 2025
Trustindex verifies that the original source of the review is Google.
Many years ago, we purchased a home in Carlsbad, using a realtor that was recommended to us - Jim Klinge. Fast forward to 2025, we recently had the privilege of selling 2 homes in Carlsbad, CA and didn't hesitate to reach out to Jim and Donna Klinge of Klinge Realty Group to guide us through the sales. The transactions were very different, each with its own unique situation, opportunities and challenges. From start to finish, Donna and Jim helped navigate the pre-sale preparation, the listing, showing of the house, buyer negotiations, the final close and all of the paperwork and decisions in between. What stands out with both transactions is the professionalism of Jim and Donna (and their team), wonderful communication (timely, relevant, concise), their deep understanding of market dynamics (setting realistic expectations), their access to top-notch contractors, and last, their ability to guide us across the finish line successfully. We wouldn't hesitate to use Jim and Donna in the future and highly recommend them for anyone looking to buy or sell a property in North San Diego County.
Jerry Meyer
March 28, 2025
Trustindex verifies that the original source of the review is Google.
We sold a home with Jim and Donna and from beginning to end they were consummate professionals. Their initial walk through the property resulted in a list of items to be repaired or updated. They supplied a list of vendors and job quotes to do the repairs and updates. We originally wanted to sell ‘as is’ and just get it over with. They gave us a selling price for ‘as is’ and options for doing a few updates/repairs to doing it all with the selling price for each option. We agreed to do all they suggested and we sold for the exact price they predicted. For every dollar spent we got back more than $2 back in the selling price. And they got that price in a rising interest rate environment! Donna and Jim are extremely detailed and guide you through ever aspect of the sale. There were no surprises thanks to their guidance. We couldn’t be more pleased with their representation.
Thank you Donna and Jim,
Jerry and Mary
Heather Quejada
March 27, 2025
Trustindex verifies that the original source of the review is Google.
We have known Jim & Donna Klinge for over a dozen years, having met them in Carlsbad where our children went to the same school. As long time North County residents, it was a no- brainer for us to have the Klinges be our eyes and ears for San Diego real estate in general and North County in particular. As my military career caused our family to move all over the country and overseas to Asia, Europe and the Pacific, we trusted Jim and Donna to help keep our house in Carlsbad rented with reliable and respectful tenants for over 10 years.
Naturally, when the time came to sell our beloved Carlsbad home to pursue a rural lifestyle in retirement out of California, we could think of no better team to represent us than Jim and Donna. They immediately went to work to update our house built in 2004 to current-day standards and trends — in 2 short months they transformed it into a literal modern-day masterpiece. We trusted their judgement implicitly and followed 100% of their recommended changes. When our house finally came on the market, there was a blizzard of serious interest, we had multiple offers by the third day and it sold in just 5 days after a frenzied bidding war for 20% above our asking price! The investment we made in upgrades recommended by Jim and Donna yielded a 4-fold return, in the process setting a new high water mark for a house sold in our community.
In our view, there are no better real estate professionals in all of San Diego than Jim and Donna Klinge. Buying or selling, you must run and beg Jim and Donna Klinge to represent you! Our family will never forget Jim, Donna, and their whole team at Compass — we are forever grateful to them.
Lou F
March 27, 2025
Trustindex verifies that the original source of the review is Google.
WeI had the pleasure of working with Klinge Realty Group to sell our home in Carmel Valley, and I cannot recommend them highly enough!
Jim and Donna demonstrated exceptional professionalism, offering expert guidance on market conditions and pricing strategy, which resulted in a quick and successful sale.
Communication was prompt and we were well-informed throughout the entire process.
For anyone looking for a dedicated and knowledgeable real estate team, look no further!
---
William Sams
March 25, 2025
Trustindex verifies that the original source of the review is Google.
Donna and Jim Klinge of Klinge Realty Group have our highest possible recommendation. From Donna and Jim’s first visit to our house through closing their advice and counsel was candid and honest in all dealings. They kept us fully informed throughout the process. The house sold less than three days after listing with a two-week closing. My wife and I have sold several houses during our lives. This was by far the best experience. Klinge Reality is a premium service realtor. You can’t make a better choice for someone to sell your home fast and for top dollar.
Emily Hernandez
December 29, 2024
Trustindex verifies that the original source of the review is Google.
Donna and Jim provided exceptional support and professionalism throughout the entire process. We couldn't have been happier with their efforts. They made our house shine, and thanks to their expertise, it sold above the listing price in the very first weekend! Truly a fantastic experience from start to finish.
Jesus Adrian Sahagun
November 11, 2024
Trustindex verifies that the original source of the review is Google.
This year has been difficult on our family, mainly due to having to sell our home. Thankfully we knew God had a plan for us and working with the Klinge team was a key part of it. It was an obvious decision to work with them again after such an amazing experience when purchasing the same home we needed to sell. The challenge was, how will we do this in so little time with so much going on? Jim and Donna held our hand every step of the way. Whenever an unexpected issue arose they found and provided a solution. Never once did we feel pressured to make a decision and the Klinges were always reassuring after providing the information that the decision was ours to make. Despite the curve balls, they never panicked and exemplified the “can do” attitude, making us feel optimistic and taken care of. Their expertise and professionalism was superb. But of all the reasons to work with the Klinges, the most impactful and valuable is their compassion and genuine care for their clients. We pray that we can one day purchase our forever home and you better believe that Jim and Donna will be representing us - as long as they will have us of course. Thank you again Klinge team! Your execution, experience, and care are unmatched.
SABIHA PASHA
July 23, 2024
Trustindex verifies that the original source of the review is Google.
Jim and Donna were fantastic! Jim understanding my needs, recommending potential places, pointing out the pros and cons of each property was invaluable. Then when the offer was accepted Donna’s organized guidance through the inspections, paperwork etc made the whole process seem effortless.
So grateful that I had them on my side!
Anu Koberg
July 13, 2024
Trustindex verifies that the original source of the review is Google.
We first found Jim through his blog at bubbleinfo.com, which really showcased his knowledge of SoCal real estate. Since then we've done three transactions with Jim and Donna, and they are an incredible full service agency, with Jim's deep market insight and Donna's deft contract and project management. We trust them implicitly in their analysis and strategy, which is based on years of experience. They're always available and on top of things, and we strongly recommend them to anyone.