

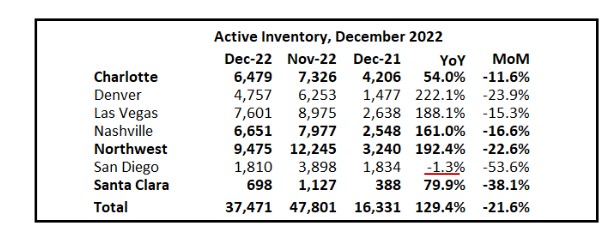
Inventory has exploded everywhere…..except San Diego, and look at the MoM drop. The number of homes for sale last month was cut in half – down to 1,810 active listings in a county of 3.3 million people!
The inventory crisis is likely to continue, and keep pricing elevated.
How does the current environment compare to previous years? IT DOESN’T – we’ve never seen anything like this. Here are the annual stats including a couple of early years for perspective:
San Diego County Detached Homes, Annual
| Year | ||||
| 2003 | ||||
| 2009 | ||||
| 2015 | ||||
| 2016 | ||||
| 2017 | ||||
| 2018 | ||||
| 2019 | ||||
| 2020 | ||||
| 2021 | ||||
| 2022 |
San Diego County had been listing 33,000 to 35,000 homes for sale every year for decades. Now we’re down to 25,000 annually….or less?
The media will keep publishing national stories about exploding inventory and plummeting prices which will only scare off many potential sellers – and they only need to hear it once or twice before postponing their plans to some indefinite date in the future. If you thought it was a ‘bad time’ to sell, wouldn’t you?
But when is the best time to sell your house?
When everyone else isn’t!
Today there are only 1,761 houses for sale countywide, and the median list price is $1,099,000!
Statistically, it sounds like a good time to sell.


There are what? 35,000 agents. That’s about 1/4th of a house per year.
It’s a lot of business cards gathering dust.
It’s comments like these that reluctantly cause you to put up with me.
Seriously. An estimate of how many “active” agents?
3,000
And they all owe you at least one “solid.”
I just hope they’re reading here!