It was the most insane frenzy ever, and it was the most intense at the beginning of last year as inventory started to thin out. Compared to that environment, I think these stats look pretty good:
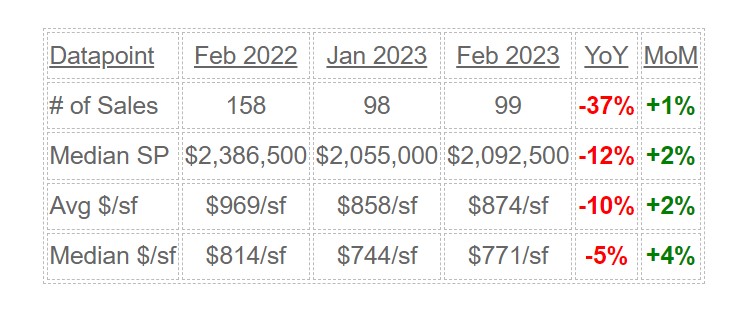
NSDCC Monthly Sales and Pricing
Down 5% to 10% YoY, and on the rise? I’ll take it!
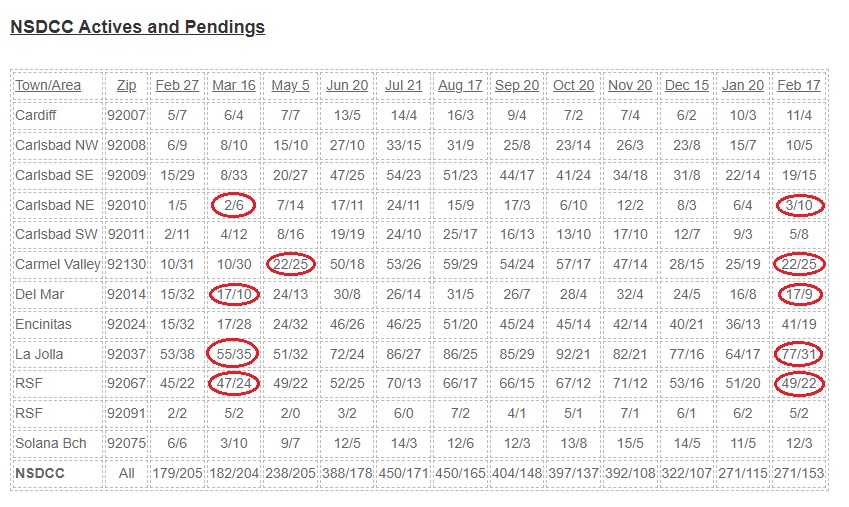
The reason for breaking down the active and pending listings by zip code is to give the readers a closer look at their neighborhood stats.
Most areas look healthy (ratio of 2:1 or better), and those in red have very similar to numbers to last spring which was probably the hottest frenzy on record:
The number of pendings has risen 33% in the last month, and the active listings are restrained. There aren’t any signs of panic and there have been some eye-popping sales already this year that makes you think the frenzy conditions are still around.
We are set up for a boisterous selling season, in spite of high prices, high rates, and high skepticism!
You might think that the frenzy conditions are starting to percolate again after watching this video! There were 13 offers submitted, and the winner had agreed to pay $1,410,000. But once they found that it needed a roof and other stuff, they agreed to a $40,000 reduction in price.
Plus it features the first time I have fallen down while filming!
I said on the Frenzy Cruise that I’d also recognize the NSDCC sales that closed well under their list price. It’s good for potential sellers to see how buyers will lowball homes that have been on the market for a while – and encouraging for buyers to know that they might be able to get a deal if they play the game wisely.
These are sales from November, with percentages off their original list price:
-17%
-14%
-23%
-19%
-15%
-10%
-23%
-10%
-16%
-32%
-16%
-20%
-11%
-15%
-15%
-13%
-26%
-17%
-23%
-12%
-20%
-14%
-13%
-29%
-19%
-16%
-22%
-12%
-14%
-14%
-18%
-28%
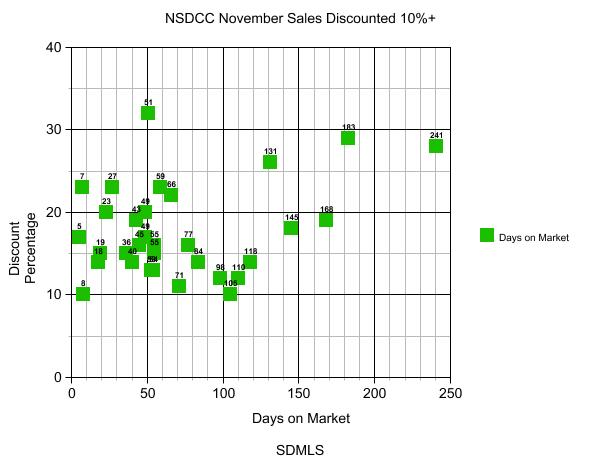
There have been 94 NSDCC closings in November (so far), and 34% have been discounted by a double-digit percentage off the original list price – which isn’t too bad, given the negativity everywhere. It happens at all price points too.
Two conclusions from the clusters in graph below:
Once a home has been on the market for 30-40 days, sellers are ready to deal.
Sellers who go beyond 100 days on the market are really taking a chance.
There were 13 of the 32 sales who ‘refreshed’ their listing, or had it on the market this year with a different agent – those DOM are not reflected here. There were quite a few at the -8% and -9% too.
Five of the 32 were round-tripped.
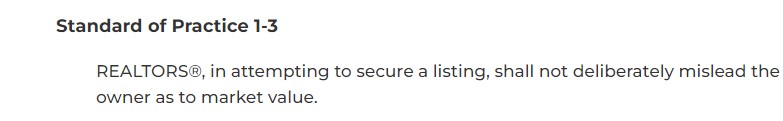
Because it is unethical to deliberately list a home for sale at an unrealistic price, it means that in a third of the cases, the listing agents just flat-out got the price wrong by a double-digit percentage. Can you imagine if doctors, lawyers, stockbrokers, plumbers, or burger-flippers were wrong a third of the time?
There probably aren’t many people today who expect to see any frenzy left in the marketplace. But here’s a view from the street, looking at actual sales closed over the last 30 days.
At 22 minutes, this turned into a full-length feature film (sorry), but consider it an audio track about the current market conditions, with video evidence to support it.
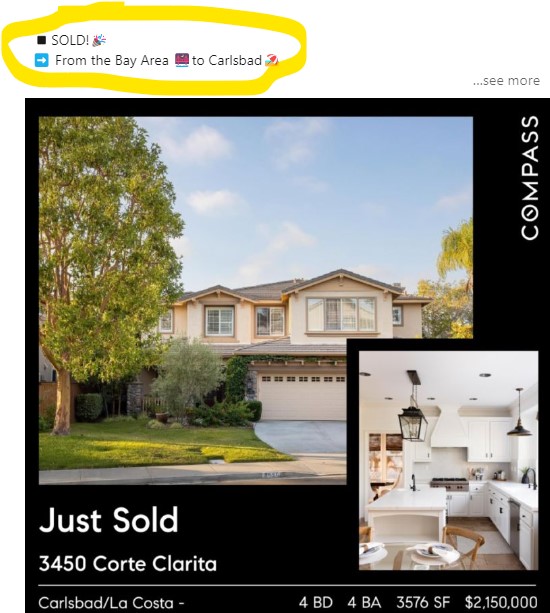
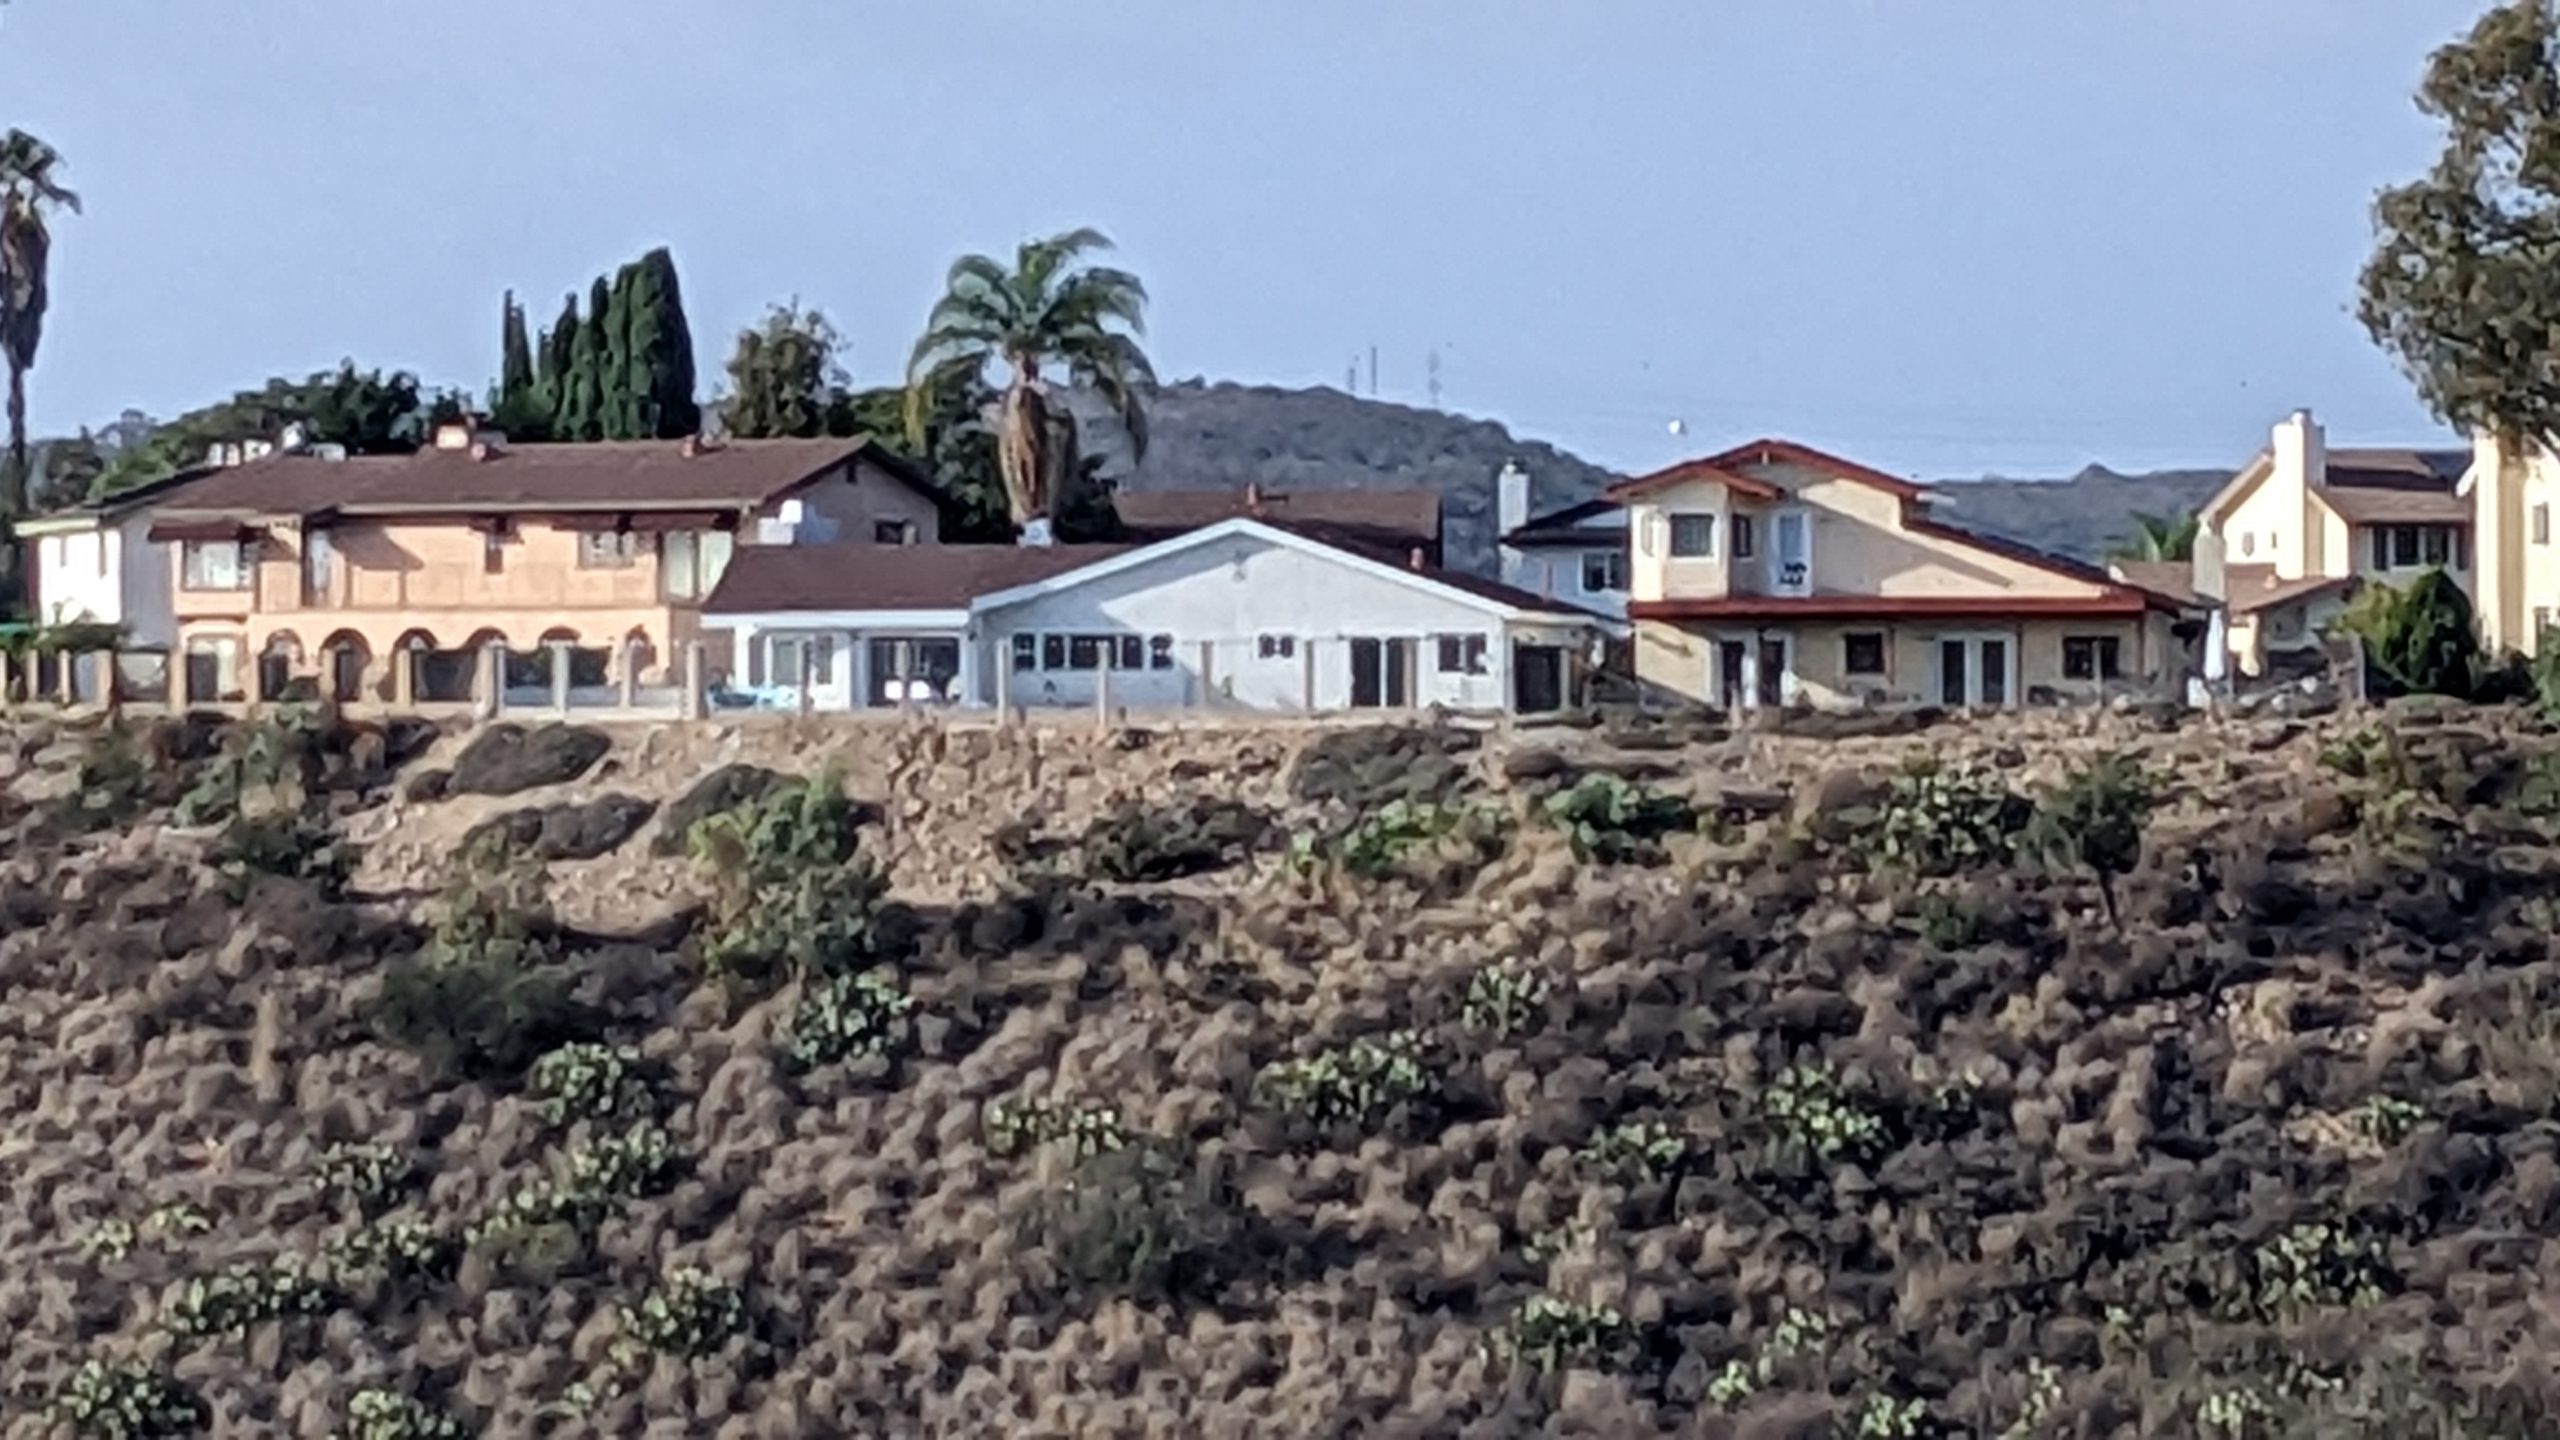
The biggest fear for the North San Diego County coastal region is a meltdown in Bay Area prices.
It’s been estimated that 50% or more of the buyers who were bidding up homes here during the frenzy are from the Bay Area, and Silicon Valley in particular. If prices were to drop 23% to 30% there, it would impact how much they would be willing to spend on replacement homes here.
This is only one example but we can say that this sold at the peak of the market, or close.
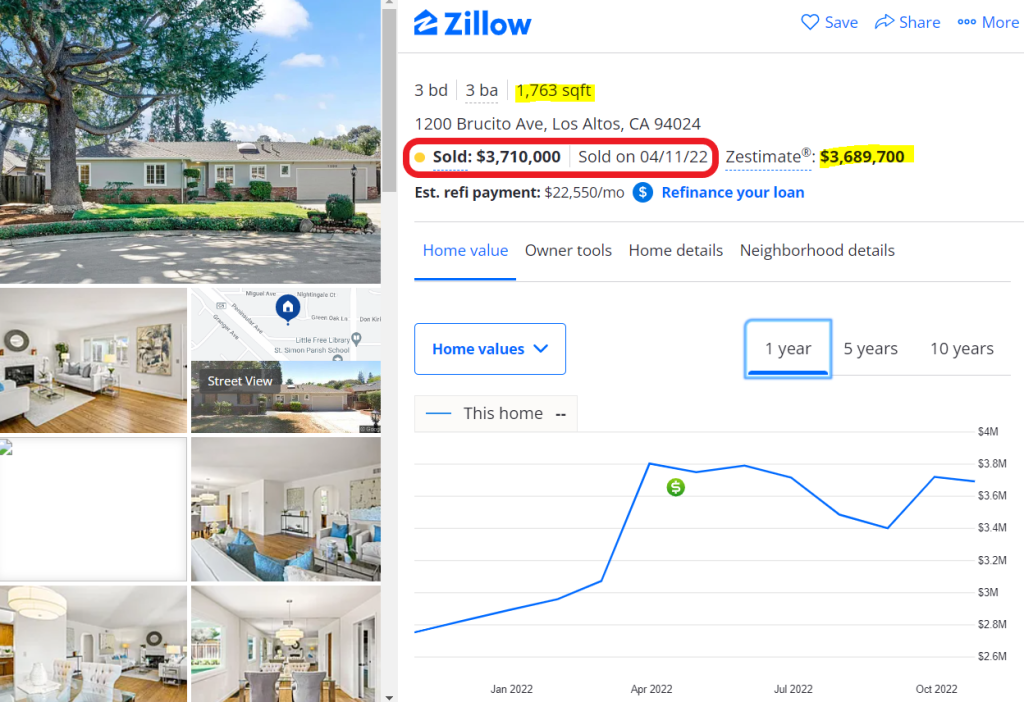
This was my uncle’s girlfriend’s house, and when I was there in November to pay my last respects, I told them that my guess at the current value was high-$2,000,000s.
They hired a good agent who spruced it up and staged it, and they listed for $3,195,000 on March 2nd.
A month later, it closed for $3,710,000 for 1,763sf.
How does it look today?
Today’s zestimate is within 1% of the sales price in April, which had been bid up $515,000 over the list price at the time. What are the comps that Zillow says they used to determine the value?
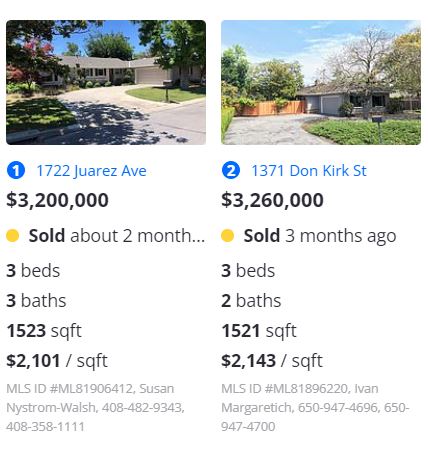
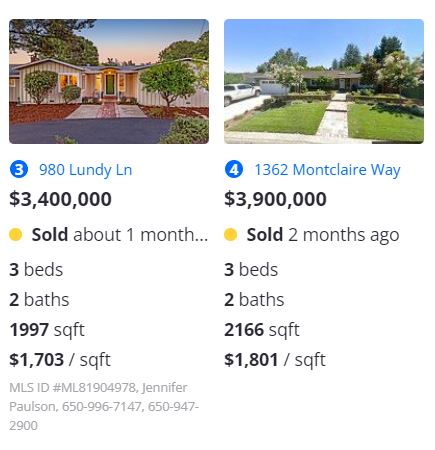
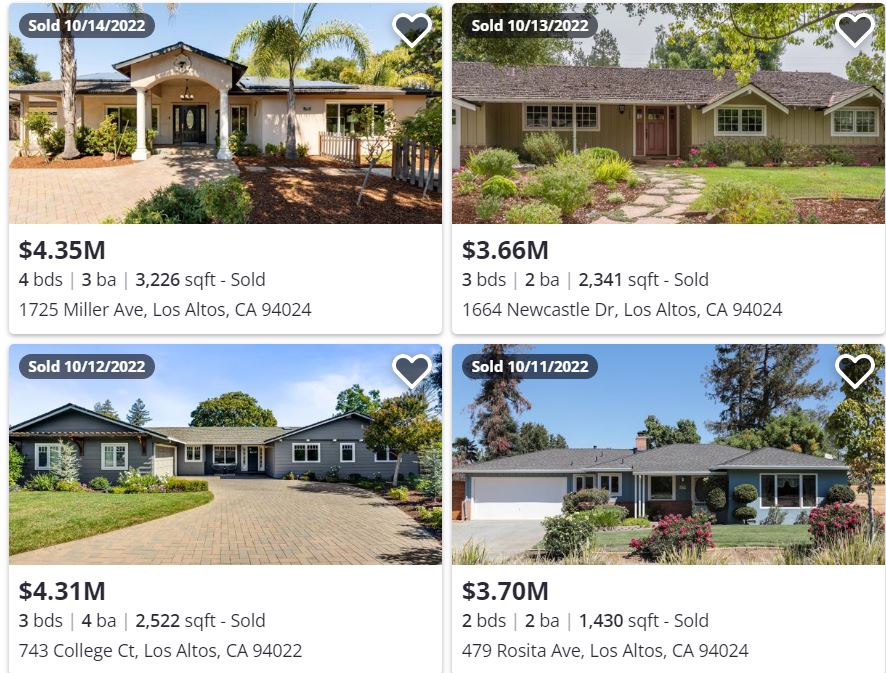
Four recent closings:
It is only one example, and certainly, not everyone from Los Altos is moving here. But just looking at those four recent sales, it seems like that area is holding up pretty good.
Between trying to watch the Padres game on my phone and the crowds of people looking at the house yesterday, I couldn’t get any more footage than this:
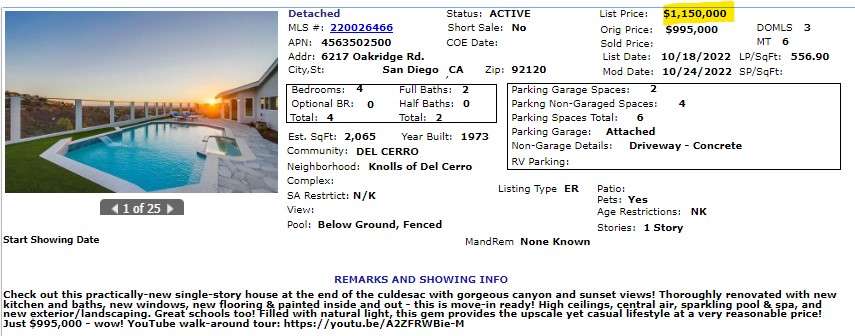
After having roughly 300 people attend the two open houses, we have received 14 offers!
We have countered all of the offers because agents don’t know who will go higher – why limit the seller response to just the top 3 or 5 offers? We countered $1,150,000 to every buyer to narrow down the group of contenders willing to go to at least that amount, and then I’ll do the jimjamalama.
Stay Tuned!
We did adjust the price upward this morning to alert the newcomers to our new starting point:
There were a few comments, mostly from neighbors, that accused me of deliberately starting with an ultra-low price to attract more people. Given the recent sales nearby, the current market conditions, and especially the active listings sitting around unsold, I thought it was an attractive price. I never fear pricing too low because I know how to handle a fair bidding process so everyone has a chance to pay top dollar.
The national bashing of the real estate market continues unabated, and I’m sure there are individual markets that are really feeling it. But real estate is local, so let’s examine the facts.
To get a sense of what has been happening since rates got into the 6s, let’s review NSDCC homes that have gone pending recently. You don’t have to know the streets or the particular homes – just scroll through the bunch and you’ll get the feeling that frenzy pricing is still lingering. Click on any for the full listing: