

The reason for breaking down the active and pending listings by zip code is to give the readers a closer look at their neighborhood stats.
Most areas look healthy (ratio of 2:1 or better), and those in red have very similar to numbers to last spring which was probably the hottest frenzy on record:
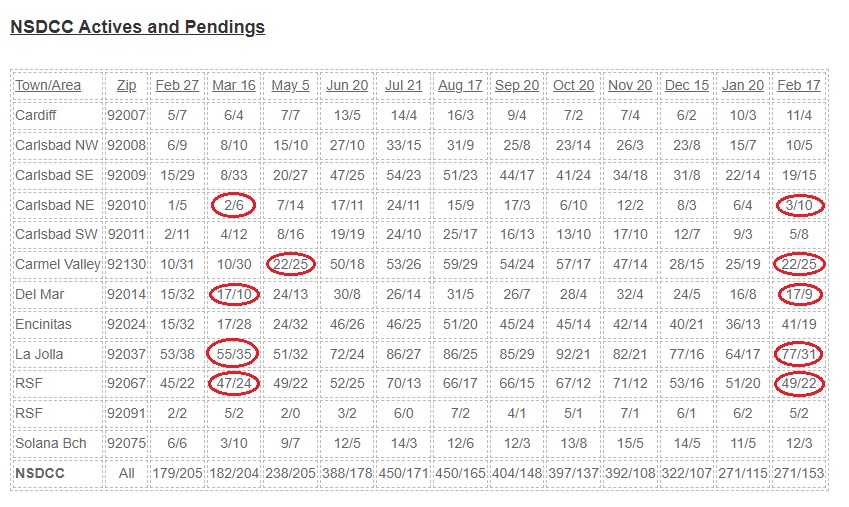
The number of pendings has risen 33% in the last month, and the active listings are restrained. There aren’t any signs of panic and there have been some eye-popping sales already this year that makes you think the frenzy conditions are still around.
We are set up for a boisterous selling season, in spite of high prices, high rates, and high skepticism!


0 Comments