This guy saw it like I did – that there would be “the great senior sell-off”, but he had more concern that the millennials wouldn’t be there to pick up the pieces. He is back-pedaling now on when it will happen – and I think he is just guessing. It will happen when it happens, and each neighborhood will be affected differently. Hat tip daytrip!
It’s a dilemma that has preoccupied Arthur C. Nelson, a U of A professor who spoke with former CityLab staff writer Emily Badger in 2013 about what he dubbed “the great senior sell-off.” Nelson postulated that Boomers would soon be selling their homes in droves, but would be hard-pressed to find buyers—mainly because Millennials wouldn’t want to buy them.
Nelson pointed to the affordability issue as well as the fact that about a quarter of Millennials prefer urban housing, such as condos or townhouses, over the detached suburban homes that were the Boomers’ preferred habitat. Younger buyers, he said, will also be looking for starter homes—smaller than the big Colonials and split-levels that line America’s cul-de-sacs. “We can predict the next housing crash,” he said at the time. “That’ll be in about 2020.”
Four years later, Nelson tells CityLab that he believes the sell-off will still occur—but later, in the mid- to late 2020s.
This has to do with people deciding to defer selling their homes, hoping to get a better price later than settling for a lower price now. “Home values in much of the country are still less than those before the Great Recession of 2007 to 2009,” he says. Prior to the recession, the typical homeowner would sell a house about every six years. “It was like clockwork,” says Nelson. “This drove a lot of planning and development projections.”
“It’s not that Boomers are going to ‘age in place,’” says Nelson. “They’re going to be stuck in place, and they’re going to make the best of it.” Those who can afford it will remodel.
Though Jennifer Molinsky, a senior research associate at Harvard’s Joint Center for Housing Studies, agrees that exurbs and rural areas will likely be vulnerable to the Boomer/Millennial housing mismatch, she’s not as pessimistic about the sell-off as a whole.“The Baby Boomers are a large generation,” she says. “Nothing they do is going to happen en masse.” She also believes that the Boomers who don’t age in place will demand an increasing array of housing options that will help spread out sales over time, decreasing the likelihood of a sudden glut of housing.
Here’s a conversation with one of my favorite clients of all-time – an out-of-state buyer who just bought a house literally by video, and avoided the usual major inconveniences!
Huntington Beach residents Chris Birtwistle and Allison Naitmazi were about to get married and decided it was time to buy a home.
They wanted to stay in the area but couldn’t find a house they both liked and could reasonably afford — despite a dual income of around $150,000.
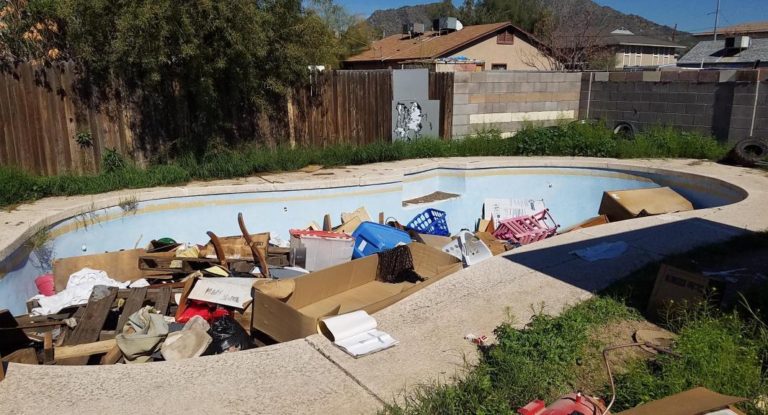
So they decided to go inland — all the way to Arizona, where they recently opened escrow on a $240,000 four-bedroom house with a pool, just outside Phoenix. Their monthly mortgage payment will be about $500 less than what they paid for a two-bedroom apartment in the Orange County beach community.
“The only hesitation was [leaving] the great weather,” the 31-year old Birtwistle said. “But we talked about what we can get here and what we can get there for the same price and that was a no brainer.”
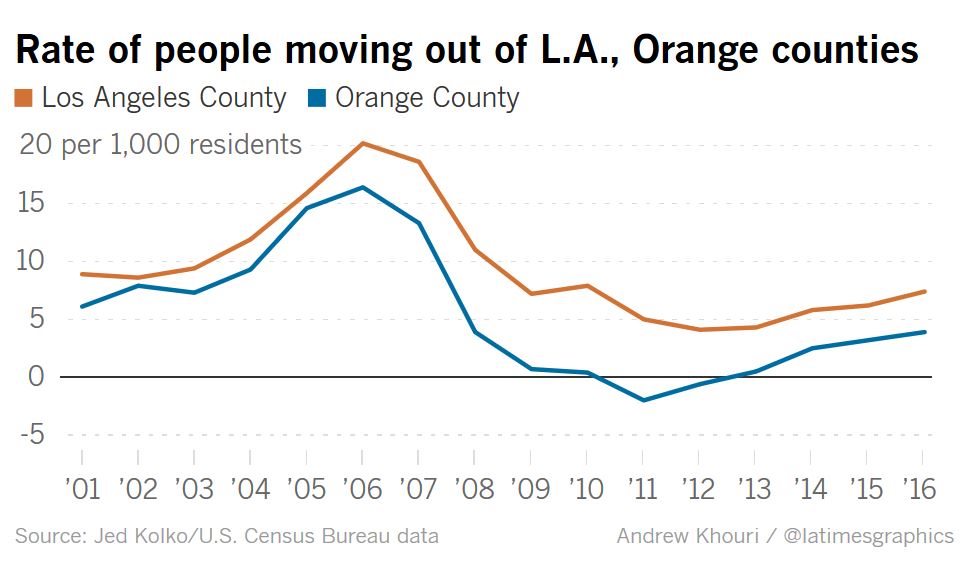
Moves out of the area remain far below levels seen during last decade’s housing bubble, when out-migration was nearly triple what it was in 2016 — and real estate agents urged clients to “drive until you qualify.”
But after slowing down in the aftermath of the Great Recession, which devastated the housing market, out-migration is picking up as prices climb steadily higher, according to U.S. Census Bureau data.
To escape high prices, people — often younger and with lower- or middle-class incomes — are looking toward the Inland Empire and nearby states for additional square footage and a lower mortgage payment.
“[Migration] is settling back into longer-term patterns,” said Jed Kolko, chief economist with employment website Indeed.com who analyzed the data.
Others were more blunt.
“The impact is to create an auction situation between the haves and the have-nots,” Christopher Thornberg, founding partner of Beacon Economics, said of the housing shortage. “And the have-nots have to move away.”
From our friends at John Burns Consulting, who have been very diligent in their reporting of market conditions over the years:
Once again, we have completed our annual housing bubble check-in. Assessing the criteria that 73 industry executives identified in 2013, we found three qualitative signs of a bubble, two signs of a mini-bubble, and five signs of no bubble. Click here to see our infographic Top 10 Signs of a Market Bubble. Every month, we analyze the quantitative stats in our analysis of 70+ MSAs for our research subscription members. We have concluded that affordability in some markets is the only sign of a bubble that we can find.
Our view on the 10 qualitative stats follows:
3 Bubble Signs
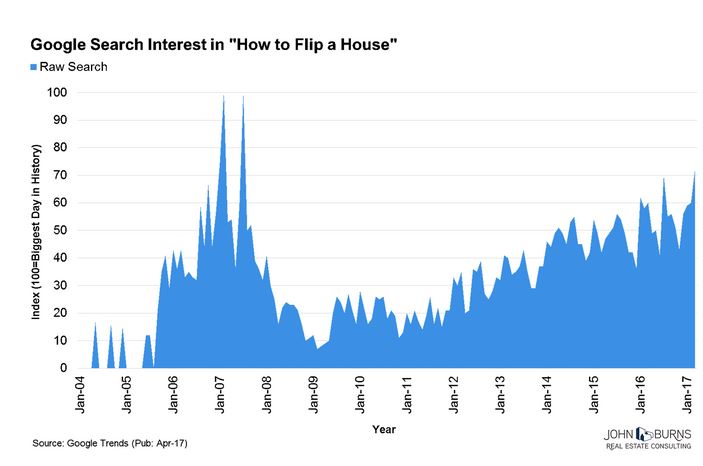
Reality TV. While home builders aren’t giving away free houses every Sunday night like they were on Extreme Home Makeover (ABC) in 2005, shows like Flip or Flop (HGTV), Home Free (Fox), and Deed (CNBC) have been captivating audiences recently. House flipping has become a big business fueled by hard money loans made by non-banks, and Flip or Flop just announced its expansion to five new cities.
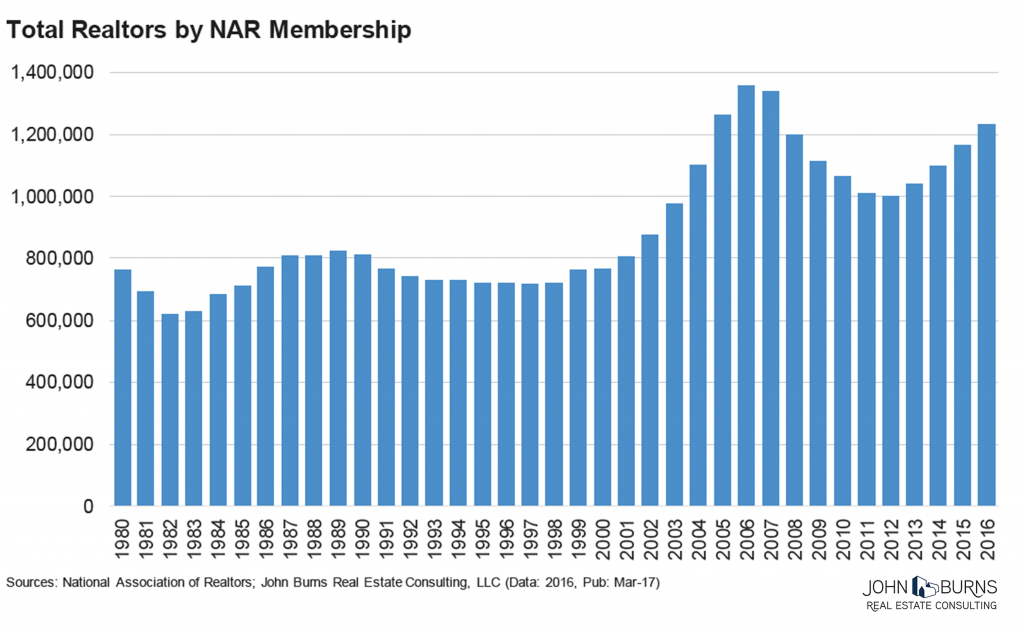
Booming real estate careers. NAR membership has rebounded strongly, pushing near-2005 levels despite far fewer transactions than in 2005. On a recent flight to the hot Portland housing market, one of our team members overheard the flight attendants discussing getting their real estate license. See the chart below.
Creative mortgages. Headlines around excessive mortgage documentation and fewer loans to low-credit borrowers mask what is really going on in the market. Per AEI, 56% of borrowers put down 10% or less of the purchase price, and 35% have debt service above 42% of their gross income. Lending is clearly not as aggressive as in the 2005–2007 period, which resulted in a 19% default rate. But it is far more aggressive than in the early 1990s, which would have had only a 6% default rate during the last downturn. Today’s loans would have a 12.2% default rate under the 2007 downturn scenario.
The overall environment can be sized up by comparing how many houses have sold, compared to the number of new listings hitting the market.
A surge of new listings can set buyers back on their heels. We could make that case about what happened last spring, when we had 100 more NSDCC listings hit early, and sales dropped a bit from the previous year:
NSDCC Action Between Jan 1 and April 10th
Year
# of Closed Sales
# of New Listings
CS/NL
% of Sales Over $1M
2013
765
1,481
52%
40%
2014
678
1,408
48%
51%
2015
730
1,445
51%
58%
2016
639
1,550
41%
58%
2017
648
1,368
47%
61%
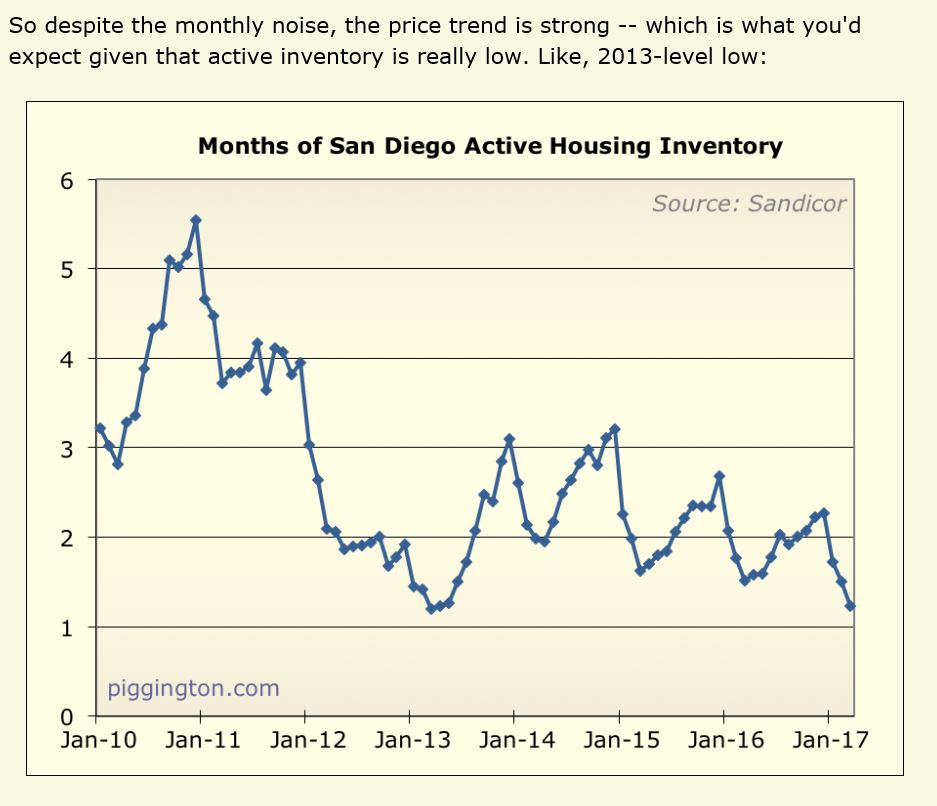
The 41% from last year looks like the anomaly now though, and this year looks stronger than ever, with sales maintaining last year’s pace in spite of almost 200 fewer listings! All while the lower end has been disappearing – this year we have 61% of our sales over $1,000,000!
Coachella is coming up this weekend, and I’ve never heard of most of the bands playing. But Kayla likes this one, and with their name, we have to play it here!
Here’s another way to demonstrate the ‘tight inventory’.
In our MLS, all new listings throughout the county are sequentially assigned a listing number. Yesterday, I inputted a listing that got #170017800. The first two numbers are the year of the input.
In previous years, on what date did listing #0017800 get inputted?
120017800 – April 4, 2012
130017800 – April 8, 2013
140017800 – April 4, 2014
150017800 – April 1, 2015
160017800 – April 4, 2016
170017800 – April 10, 2017
The inventory flow has been remarkably consistent – lately we’ve had 17,800 properties get listed in the first 91 to 100 days of the year. They may not be where you want them, or at the price you prefer, but there has been a steady flow to consider!
If you are thinking of buying on the higher end and willing to consider other areas, there are plenty for sale. In fact, there are over 17,000 homes for sale in California listed over $1,000,000 – including one in Bakersfield!
Speaking of my listing #170017800, I’ll be there today 1-4pm!
Are you surrendered to buying a home from a down-sizing baby boomer? Be ready for some unique features! When this turns into a sticky substance, the new paint doesn’t stick well – I had a case where we were scraping the nicotine off the wall with razor blades!