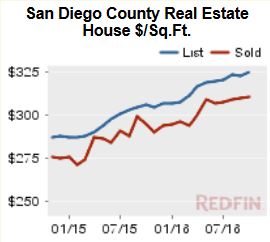
Yesterday I mentioned the idea of slightly more inventory could lead to more sales and faster-rising prices – but too much could freeze up the demand.
Is there history upon which we can reflect?
We know that the local market in 2013 reached full-blown red-hot frenzy level. Inventory for the first nine months rose 12%, and sales rose 10% – and pricing went ballistic. We probably won’t see it that hot again.
NSDCC Listings and Sales, First Nine Months (Jan-Sept.)
Year
Number of Listings
Median LP
Number of Sales
Median SP
L/S Ratio
2011
4,308
$949,000
1,980
$835,206
2.18
2012
3,655
$975,000
2,322
$825,000
1.57
2013
4,091
$1,159,000
2,554
$945,000
1.60
2014
3,930
$1,249,700
2,183
$1,028,564
1.80
2015
4,068
$1,295,000
2,362
$1,090,000
1.72
2016
4,187
$1,399,000
2,272
$1,170,000
1.84
But consider the 2014-2015 differences.
The inventory went up 4%, and sales went up 8%! But there wasn’t much increase in list pricing (under 4%), which probably helped to soothe the buyer anxiety, and keep things moving. The median sales price did rise 6%!
How about this year?
Another 3% increase in inventory, but a 4% decline in sales. But look at the increase in the median pricing – an 8% rise in the median list price and 7% increase in the median sales price, with both at all-time record highs.
There is a fine balance between sales and price, but I think if sellers can keep their pricing enthusiasm in check, the party will keep rolling! Can we all live with appreciation around 0.5% per month, where it has been for the last three years, and expect that it could be a little less as prices enter the stratosphere?
The RSF real estate struggle (232 active listings, 21 sold last month) is compounded by the newer communities surrounding the Ranch that have natural gas and sewer, and where you don’t have to grapple with maintaining 2+ acres. Additionally, having modern conveniences like grocery stores and internet makes a difference for home buyers!
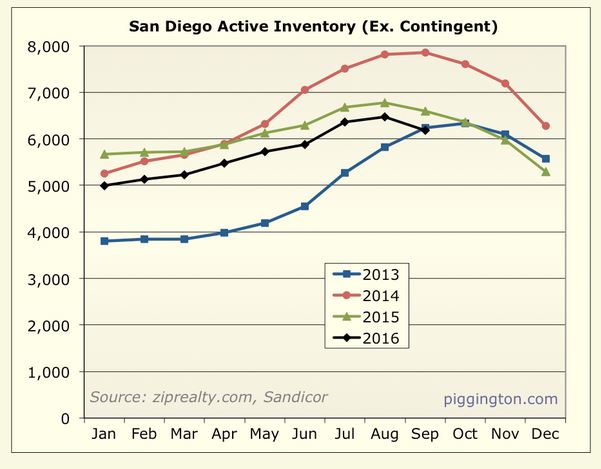
It is remarkable how similar this year’s inventory has been to last year’s – and the trajectory is virtually identical as well.
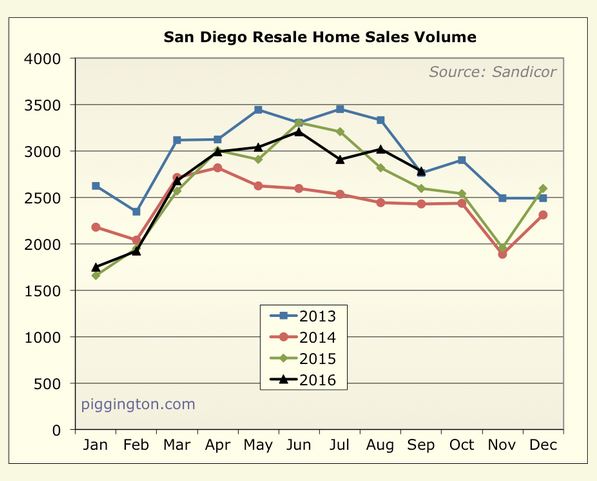
Sales have been strong too, in spite of the higher pricing:
Judging by those graphs, market conditions are ideal – could it get any better?
I think so! If we had about 10% more inventory, the demand would soak it up and probably cause prices to go up faster too. I say 10% because it wouldn’t be that noticeable – if there was a 20% or more increase in inventory, buyers would most likely adopt a wait-and-see attitude because historically, we are overdue for a correction. But it’s been different this time – higher prices haven’t brought more sellers to market.
It’s still Wednesday! I didn’t attend the Desert Trip first weekend, but I’ve seen video of all six bands. I think Bob Dylan’s opening number stole the show (the camera stops spinning after 23 seconds):
P.S. Bob Dylan is 75 years old – which is older than any Desert Tripper (beats out Charlie Watts by a couple of weeks).
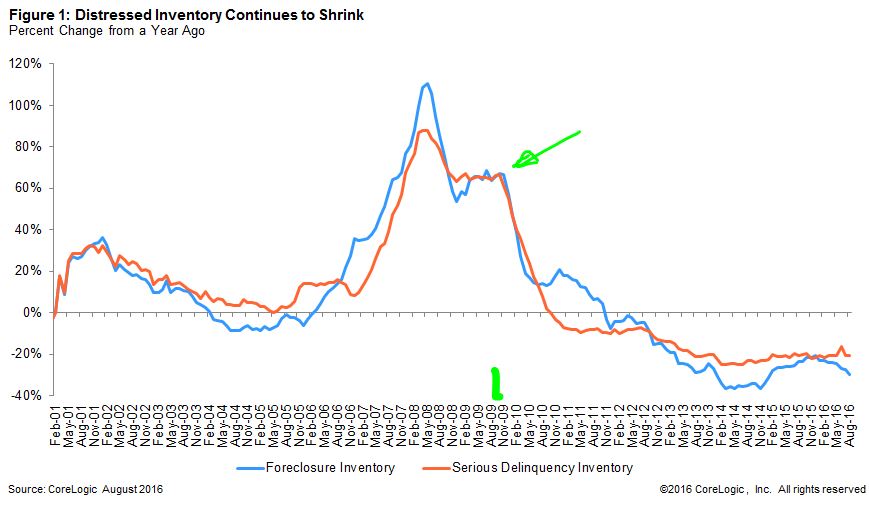
The latest foreclosure numbers are out, and we’re down to less than 1% of all mortgages being in foreclosure:
The national foreclosure inventory – the number of loans in the foreclosure process – fell 29.6 percent year over year in August 2016, according to the latest CoreLogic Foreclosure Report. The foreclosure inventory has fallen on a year-over-year basis every month since November 2011 (Figure 1), and in August 2016 it was 77.5 percent below the January 2011 peak.
The foreclosure rate – the share of all loans in the foreclosure process – fell to 0.9 percent in August 2016, down from 1.3 percent in August 2015. While the foreclosure rate is back to 2007 levels, it is still above the pre-housing-crisis average foreclosure rate of 0.6 percent between 2000 and 2006.
But it still bugs me that NONE of the national real estate players or national media ever questions how or why foreclosures stopped. After 2+ years of 60% or more growth of foreclosures AND serious delinquencies, all of a sudden BOTH dropped off a cliff at the end of 2009.
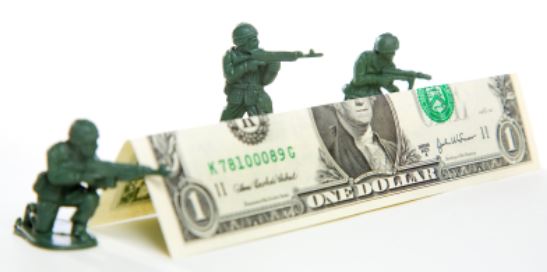
Our federal government and the banking industry obviously conspired to stem the losses, and then funded community activist groups who buy mortgages at a discount. Here is an example:
Nevada’s distressed home loans are still caught in economic quicksand, but not for lack of trying to combat banker haste with consumer-oriented ideas. The National Council of La Raza (NCLR), for example, has invested significant donor funds in efforts to bail out underwater borrowers when banks won’t negotiate fairly.
“You want to keep families in place if possible, so foreclosure is the absolute last choice that we want, if we’re involved in the transaction,” NCLR Vice President for Housing and Community Development Lot Diaz told ThinkProgress.
Diaz’s colleagues at an affiliated non-profit called Hogar Hispano purchase distressed mortgages and then return the homes to the owners at a fair market price that restores their chances of building up equity in the property. Hogar Hispano did 463 of these distressed debt acquisitions in 2013 alone, and saw a favorable outcome for the original homeowner in 316 of those cases.
Hogar Hispano also buys up houses that have already been taken over by the bank, known as REO properties, and then finds a buyer for them or converts them into rental units targeted at low- and moderate-income families. The group says its REO work has created close to 900 new homeowners and turned bank-owned homes into occupied housing more than 1,100 times, in Nevada and elsewhere. (LINK)
The whole mess just got swept under the carpet, which gave the insiders a fantastic opportunity to profit! What a country!
Tough luck for those who want a new one-story house – 42 of the 44 houses here are 2-story big bombers over 4,000sf, and up to 7 bedrooms and 7.5 baths!
When it comes down to the last 2% to 4% on price negotiation, why is there so much trouble putting a deal together?
It because the participants had no strategy going in – they just start making offers or counter-offers without regard to where it will lead.
Without a specific strategy, it’s too easy for either party to throw their hands up and say, “I don’t know how I got here, and I don’t like it!”.
This is another reason why we should adopt the auction format to home-selling. The auctioneer has a very specific strategy on price, and the increments of change – all the buyers have to do is say yes or no.
Until the auction format takes over, what can we do?
My ideas on offer/counter-offer strategy:
Keep It Simple – Negotiate in 25-50-75-99 increments, they are easier for the receiver to compute the differences. It also helps to give the other party a strategy for their response – if they are paying attention.
More Simple – If you can’t get on a 25-50-75-99 track, then sellers’ counter-prices end with a nine ($879,000), and buyers end with a zero ($850,000 or $860,000).
Buyers – Have your initial offer reflect the days on market. If you offer 5% under the list price on a house that has been listed for 3 days, you won’t get a response. Make the same offer 3 months later and the seller should be happy to engage.
Velocity – Make a big price move with your first counter-offer to encourage the other party (heck, they might be so happy they just sign it), but then pull back on the second round.
Don’t Go Longer Than Two Rounds of Counters – Parties get tired of playing, and burnout sets in quickly.
Expect to Split the Difference at Some Point – it’s a win-win solution.
Know the Other Agent’s Level of Competence – If the other agent sells less than one house per month, they are likely to willy-nilly the process. Your agent needs to help them along.
If you are the buyer, it would be nice to pick up some signs along the way to assist with setting a price strategy, and lay out your expectations mentally.
Signs of seller motivations, and what a buyer can expect:
How difficult it is to see the home. If the listing agent blows you off for a day or two, or wants to show the house at their convenience, not yours – then you can expect tough sledding ahead.
How quickly they responds to your offer/counter. If the sellers doesn’t respond within 24 hours, it means they don’t understand buyer’s remorse – and don’t care.
How close they stick to list price. The closer they stick, the more (over)confident they are.
Who the seller picked for a listing agent will tell you just about everything you need to know about your chances of success. If they select a reputable, experienced agent, then you will know because the house looks sharp, it’s easy to see, and the price is attractive. If they picked a loser, then the photos are terrible, the house looks like crap, it’s hard to see, and the price is 10% higher than comps, or on a goofy range.
Remember that it takes four things to make a deal – the right house, the right list price, the right seller, and the right listing agent. If any of those four are out of whack, then a deal is unlikely.