The New World
Their ode to presidential politics by X. This video shows a nice cross-section of America, including a glimpse of a Hobo Joe’s sign in Phoenix:
What was worse tonight – the presidential debate or the Dodger game?

Their ode to presidential politics by X. This video shows a nice cross-section of America, including a glimpse of a Hobo Joe’s sign in Phoenix:
What was worse tonight – the presidential debate or the Dodger game?
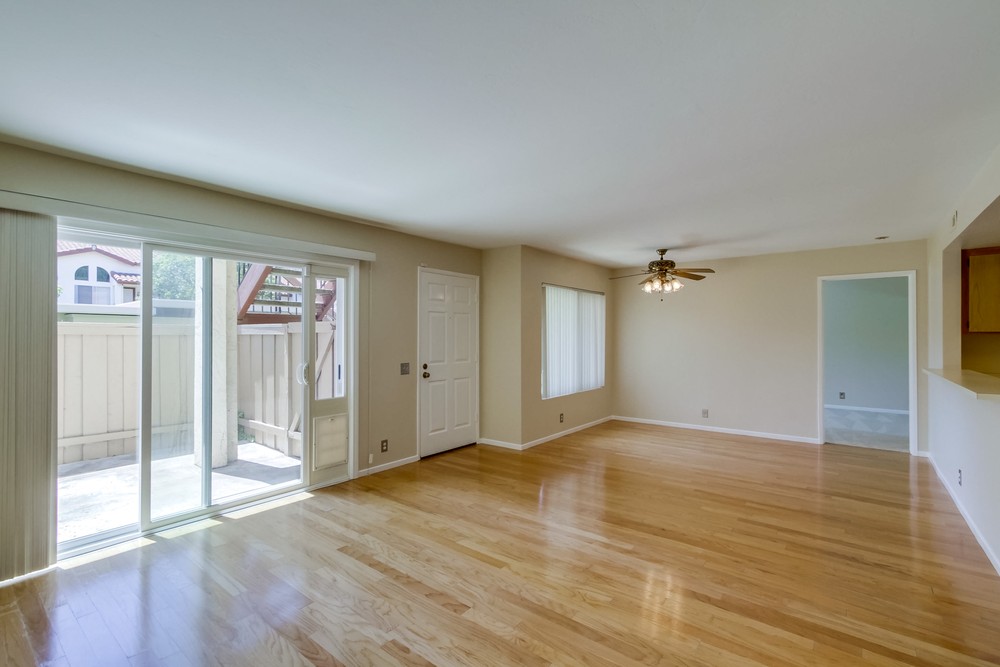
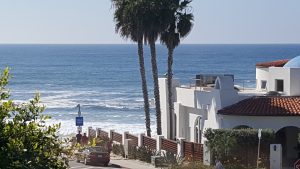
The 2br/2ba condo we are discussing in the UTC area is in a complex that enjoys high rents – this unit should fetch $2,000 per month easily. Because of the quirk in the underwriting guidelines that won’t allow financing in condo complexes that have an eminent-domain action filed, we are looking for cash buyers only – hopefully an investor will find the rent appealing!
The previous buyer was anticipating a close-of-escrow date this week – we were at the finish line. The seller wants to go back to renting the unit if we don’t find another buyer by Monday!
I marked the listing as ‘active’ again this morning, and I’ve already received two phone calls from agents!
We will be there 12-3pm for open house on Sunday too!
http://www.zillow.com/homedetails/4040-Porte-La-Paz-UNIT-82-San-Diego-CA-92122/52514005_zpid/
We’re trying to find a portfolio lender – if you know anyone, let me know. Fannie/Freddie guidelines prohibit eminent-domain litigation, even though the argument is only over how much money the HOA will receive!

As home prices increase, buyers get more picky – and it makes sense.
If they have to pay more, then they want more for their money.
This should have some lasting effects on the market:
The stats show that we’ve had more listings this year, but fewer sales:
NSDCC Detached Homes between Jan-Sept.
| Year | |||
| 2013 | |||
| 2014 | |||
| 2015 | |||
| 2016 |
Yes, the ‘re-freshing’ of listings does pad the Total Listings count, but it’s been a constant problem and helps to make the point – it’s getting harder to sell.
For sellers who don’t want to lower their price, there is an easy answer.
Do more to upgrade your home!
This is why financed buyers should consider a fixer – there is less competition, especially from cash buyers who have a better shot at the hot buys.

Back in the foreclosure era, cash buyers were everywhere, gobbling up all the deals. Many pundits thought that once the investors pulled out, the market would collapse.
But a funny thing happened on the way to the apocalypse.
It turns out, buyers love to pay cash!
They are buying the higher-end properties too, which is understandable – nobody is spending their last million or two on a house. These cash buyers probably had at least 5x the sales price in the bank!
NSDCC Detached-Home Sales, First Nine Months (Jan – Sept.)
| Year | |||||
| 2009 | |||||
| 2010 | |||||
| 2011 | |||||
| 2012 | |||||
| 2013 | |||||
| 2014 | |||||
| 2015 | |||||
| 2016 |
The depth of the affluence isn’t surprising, it is the breadth. There have been 1,465 NSDCC house sales that have closed for more than $1,000,000 this year!
It puts pressure on the financed buyers. In virtually all bidding wars, the financed offers are ignored, and just the cash offers get entertained. Financed buyers would be smart to lower their sights and pick off a fixer.
~~~~~~~~~~~~~~~~~~~~~~~~~~~~~~~~~~~~~~~~~~~~~~~~~~~~~~
It’s that time of the year – the 2017 forecasts are starting to roll out!
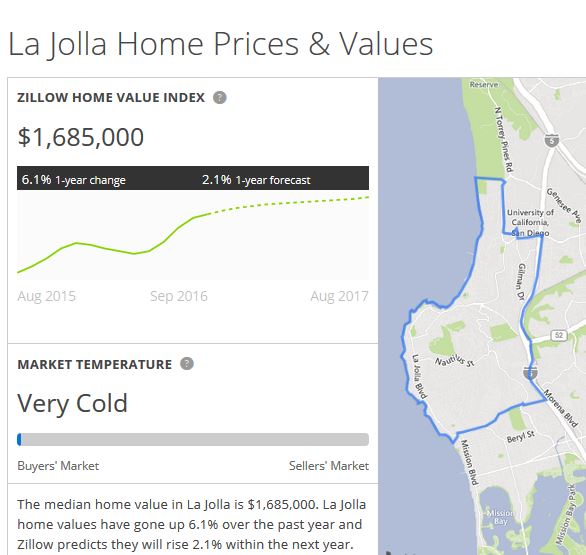
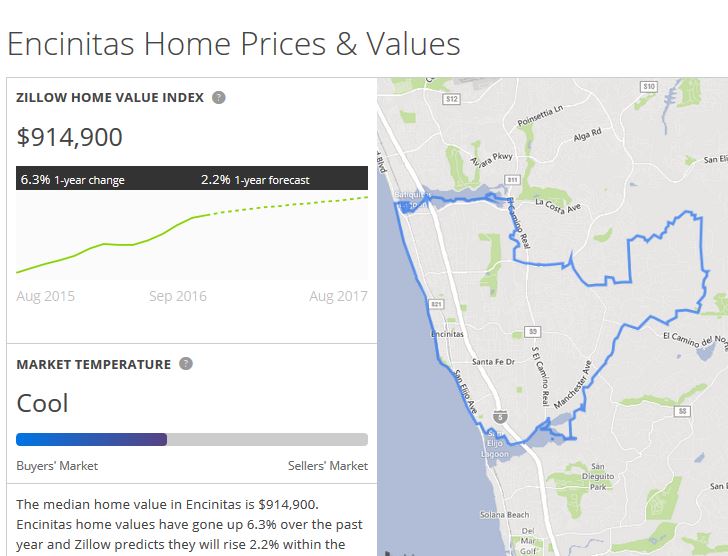
Zillow has been conservative about our local markets. For the most part, the actual appreciation of the Zillow Home Value Index has been higher than their forecasts over the last two years.
Their local forecasts for 2017 are all lower than their 2016 guesses, and what they are predicting could also be described as ‘Flatsville’. If their local forecasts of +0.9% to +2.2% come true, it would mean that several sellers would end up selling for less than they could have gotten in 2016.
Are we ready for that yet?
Local ZHVI-Appreciation Forecasts
| Town | |||
| Carlsbad | |||
| Carmel Valley | |||
| Del Mar | |||
| Encinitas | |||
| La Jolla | |||
| RSF | |||
| San Diego | |||
| Solana Beach |
The Zillow data changes slightly, depending on where you look on their website, and whether you use town names or zip codes. Here is the LINK to find others.
We rebounded from last week’s 46 new pendings – we had 60 this week!
I want to go back to my last prediction too.
I thought I said that September was hot enough that we would have more sales than August, but my actual guess was that we would beat last September – and we did! (246 sales this September vs 210 last September).
Click on the ‘Read More’ link below for the NSDCC active-inventory data:

This is the easy part – conducting an engineer-approved repair. Keeping everyone interested enough to stick around for the solution is another story!
More of the daily adventure….
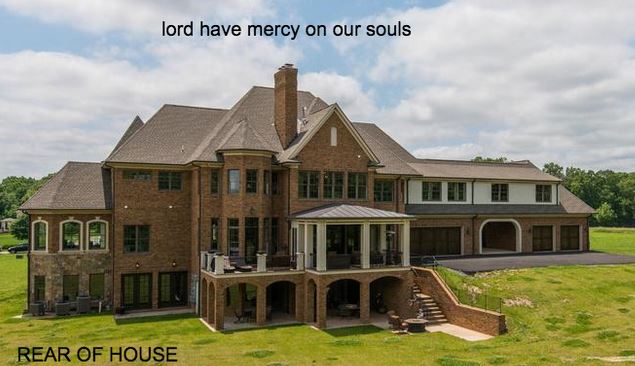
Hat tip to elbarcosr for sending in this link to McMansion humor:
http://www.mcmansionhell.com/?ncid=txtlnkusaolp00000618
Those fake columns and window trim are made of foam:


Are you looking for an experienced agent to help you buy or sell a home?
Contact Jim the Realtor!
CA DRE #01527365, CA DRE #00873197
