A quarter-point increase in the Fed funds rate won’t derail housing. However, if the Fed were to quickly follow that initial move with one or two more rate increases, housing and home prices might suffer. A stock market correction is unlikely to do much damage to the housing market; a full blown bear market dropping more than 20 percent would present some difficulties for housing and for other economic sectors.”
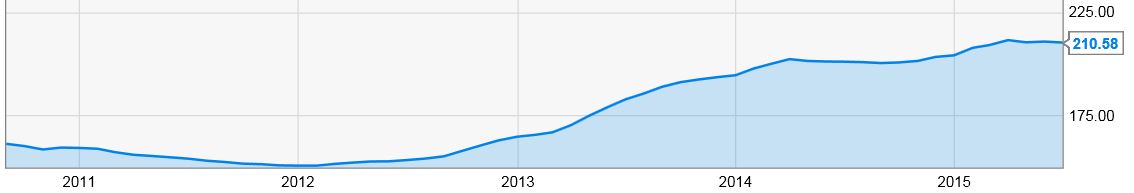
Wondering what CSI-SD will look like for the remainder of 2015? Here are the non-seasonally-adjusted numbers from last year – let’s call it flat:
Month
CSI-SD
July 2014
203.64
August 2014
203.31
September 2014
203.16
October 2014
203.07
November 2014
203.99
December 2014
203.46
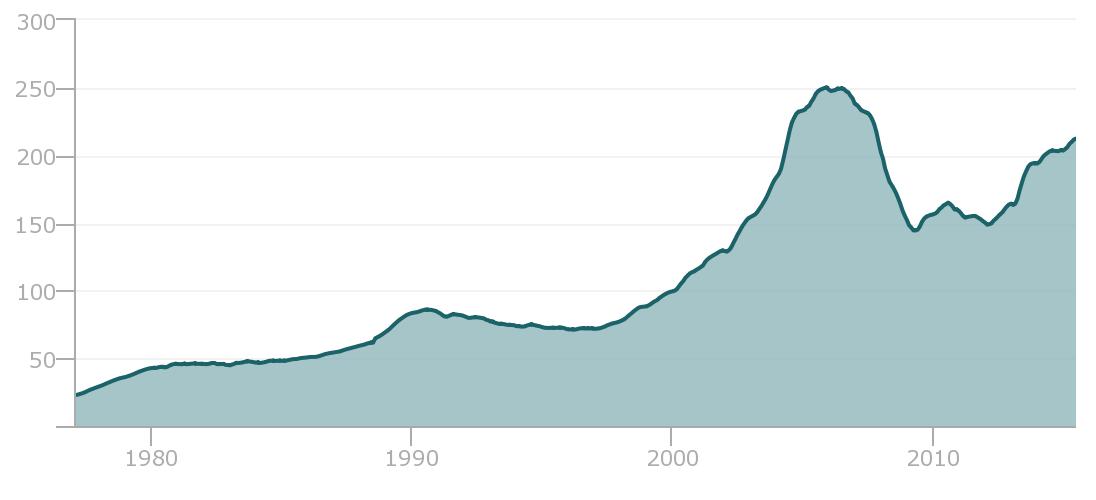
For those interested in the seasonally-adjusted numbers, the San Diego index in June declined by -0.23% month-over-month, and was +4.59% year-over-year.
Now that the pricing increases have moderated, a slow/stagnant market is likely to prevail. Sellers typically hire the agent who promises the highest price, and are happy to sit and wait for the lucky sale.
What does it look and feel like?
Check the high-end markets, where stagnation is standard. You see many of the same houses listed on and off for years, and plenty of inventory.
Today, there are 412 houses for sale over $2,400,000, which is 40% of the overall inventory. Their number has grown from 309 in early March, and approaching the highs of last September again.
But only 25 have sold in the last 30 days.
Click on the link below for the complete NSDCC active-inventory data:
There have been other projects in Carlsbad that faced an uproar. This time the complaints have ranged from gnatcatchers, to Indian remains, to increased traffic, to competition for mom-and-pop store owners.
Whatever the gripe, those who oppose had better get to a city council member or two by Tuesday, or it’s going to be over. The city council has been mum about their votes, but they have been cushy with the developer for three years.
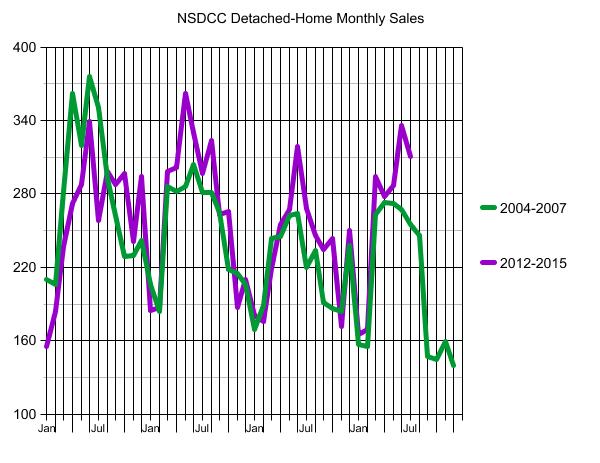
Every day we hear some pundit talking about the latest real estate bubble forming. Can we learn anything from comparing recent sales to those during the bubblicious 2004-2007 era?
Sales were dropping precipitously in 2005 and 2006 after the 2003-2004 run-up. There was one last blowout at the end of 2006 and into 2007 when Countrywide began pushing the no-doc, 100% financing up to $1,500,000.
When Angelo took away the punch bowl in the middle of 2007, the party was over – you can see how sales tanked, beginning in August, 2007.
One big difference when comparing these two eras is that the neg-am teaser rate in 2007 is today’s 30-year fixed rate. When the teaser rate went away, and people had to qualify again, the market collapsed.
It doesn’t look that way today.
This year, sales have been strong, in spite of the San Diego Case-Shiller Index rising 42% since January, 2012. If we hit an unsustainable stretch, the first indicator will be sales dropping off, like they did at the end of 2007.
2013, first half: Full tilt boogie, prices going up as fast as they can.
2013, second half: Mortgage rates rise 0.75% to snuff out price rally.
2014: Normalizing.
2015: Rates dip under 4% to begin the spring selling season, sparking a rally.
If the Fed does raise a rate this year, it won’t be much – maybe 0.25%. We will survive a similar bump in mortgage rates, and it might be a relief for it to have finally happened.
WASHINGTON—Sales of existing homes climbed in July to their prerecession pace, but low inventory and higher prices threaten to curtail those gains heading into the fall.
Existing-home sales rose 2% last month from June to a seasonally adjusted rate of 5.59 million, the National Association of Realtors said Thursday. Last month’s sales pace was the highest since February 2007 and 10.3% higher than a year earlier.
Despite relatively steady gains in home sales in the past year, thinning supply and high prices loom as headwinds that could slow the recovery. As well, mortgage rates could be poised to rise when the Federal Reserve raises short-term interest rates, potentially as soon as next month.
Total housing inventory fell 0.4% at the end of July to 2.24 million existing homes available for sale, 4.7% lower than a year ago. At the current pace of sales it would take 4.8 months to exhaust the supply of homes on the market, down from 5.6 months a year ago, the NAR said Thursday.
Jim Klinge, a real-estate agent in San Diego, said inventory is low in his area because residents are reluctant to move to another town or state. In prior years, high prices would encourage some people to sell and leave town, he said.
He said every new listing generates intense interest from buyers, such as a three-bedroom home he listed Saturday night at $579,000 for which he had already received 30 queries by Thursday.
“We have to recognize that we have a broad-based housing shortage,” said Lawrence Yun, the NAR’s chief economist. “Home builders have been essentially out of the game or underproducing” since the crash.
The median sale price for a previously owned home slipped slightly to $234,000 from June’s $236,300, but is still 5.6% higher than a year earlier. July’s prices mark the 41st straight month of year-over-year price gains.
Trustindex verifies that the original source of the review is Google.
We sold a home with Jim and Donna and from beginning to end they were consummate professionals. Their initial walk through the property resulted in a list of items to be repaired or updated. They supplied a list of vendors and job quotes to do the repairs and updates. We originally wanted to sell ‘as is’ and just get it over with. They gave us a selling price for ‘as is’ and options for doing a few updates/repairs to doing it all with the selling price for each option. We agreed to do all they suggested and we sold for the exact price they predicted. For every dollar spent we got back more than $2 back in the selling price. And they got that price in a rising interest rate environment! Donna and Jim are extremely detailed and guide you through ever aspect of the sale. There were no surprises thanks to their guidance. We couldn’t be more pleased with their representation.
Thank you Donna and Jim,
Jerry and Mary
Heather Quejada
March 27, 2025
Trustindex verifies that the original source of the review is Google.
We have known Jim & Donna Klinge for over a dozen years, having met them in Carlsbad where our children went to the same school. As long time North County residents, it was a no- brainer for us to have the Klinges be our eyes and ears for San Diego real estate in general and North County in particular. As my military career caused our family to move all over the country and overseas to Asia, Europe and the Pacific, we trusted Jim and Donna to help keep our house in Carlsbad rented with reliable and respectful tenants for over 10 years.
Naturally, when the time came to sell our beloved Carlsbad home to pursue a rural lifestyle in retirement out of California, we could think of no better team to represent us than Jim and Donna. They immediately went to work to update our house built in 2004 to current-day standards and trends — in 2 short months they transformed it into a literal modern-day masterpiece. We trusted their judgement implicitly and followed 100% of their recommended changes. When our house finally came on the market, there was a blizzard of serious interest, we had multiple offers by the third day and it sold in just 5 days after a frenzied bidding war for 20% above our asking price! The investment we made in upgrades recommended by Jim and Donna yielded a 4-fold return, in the process setting a new high water mark for a house sold in our community.
In our view, there are no better real estate professionals in all of San Diego than Jim and Donna Klinge. Buying or selling, you must run and beg Jim and Donna Klinge to represent you! Our family will never forget Jim, Donna, and their whole team at Compass — we are forever grateful to them.
Lou F
March 27, 2025
Trustindex verifies that the original source of the review is Google.
WeI had the pleasure of working with Klinge Realty Group to sell our home in Carmel Valley, and I cannot recommend them highly enough!
Jim and Donna demonstrated exceptional professionalism, offering expert guidance on market conditions and pricing strategy, which resulted in a quick and successful sale.
Communication was prompt and we were well-informed throughout the entire process.
For anyone looking for a dedicated and knowledgeable real estate team, look no further!
---
William Sams
March 25, 2025
Trustindex verifies that the original source of the review is Google.
Donna and Jim Klinge of Klinge Realty Group have our highest possible recommendation. From Donna and Jim’s first visit to our house through closing their advice and counsel was candid and honest in all dealings. They kept us fully informed throughout the process. The house sold less than three days after listing with a two-week closing. My wife and I have sold several houses during our lives. This was by far the best experience. Klinge Reality is a premium service realtor. You can’t make a better choice for someone to sell your home fast and for top dollar.
Emily Hernandez
December 29, 2024
Trustindex verifies that the original source of the review is Google.
Donna and Jim provided exceptional support and professionalism throughout the entire process. We couldn't have been happier with their efforts. They made our house shine, and thanks to their expertise, it sold above the listing price in the very first weekend! Truly a fantastic experience from start to finish.
Jesus Adrian Sahagun
November 11, 2024
Trustindex verifies that the original source of the review is Google.
This year has been difficult on our family, mainly due to having to sell our home. Thankfully we knew God had a plan for us and working with the Klinge team was a key part of it. It was an obvious decision to work with them again after such an amazing experience when purchasing the same home we needed to sell. The challenge was, how will we do this in so little time with so much going on? Jim and Donna held our hand every step of the way. Whenever an unexpected issue arose they found and provided a solution. Never once did we feel pressured to make a decision and the Klinges were always reassuring after providing the information that the decision was ours to make. Despite the curve balls, they never panicked and exemplified the “can do” attitude, making us feel optimistic and taken care of. Their expertise and professionalism was superb. But of all the reasons to work with the Klinges, the most impactful and valuable is their compassion and genuine care for their clients. We pray that we can one day purchase our forever home and you better believe that Jim and Donna will be representing us - as long as they will have us of course. Thank you again Klinge team! Your execution, experience, and care are unmatched.
SABIHA PASHA
July 23, 2024
Trustindex verifies that the original source of the review is Google.
Jim and Donna were fantastic! Jim understanding my needs, recommending potential places, pointing out the pros and cons of each property was invaluable. Then when the offer was accepted Donna’s organized guidance through the inspections, paperwork etc made the whole process seem effortless.
So grateful that I had them on my side!
Anu Koberg
July 13, 2024
Trustindex verifies that the original source of the review is Google.
We first found Jim through his blog at bubbleinfo.com, which really showcased his knowledge of SoCal real estate. Since then we've done three transactions with Jim and Donna, and they are an incredible full service agency, with Jim's deep market insight and Donna's deft contract and project management. We trust them implicitly in their analysis and strategy, which is based on years of experience. They're always available and on top of things, and we strongly recommend them to anyone.
Bjorn Isachsen
July 10, 2024
Trustindex verifies that the original source of the review is Google.
The Good
The Klinge Realty Group operates like a finely tuned machine, with a very personal touch. We contacted them on a Sunday and they were talking to us about our family and our needs on our living room couch the following day. They carefully listened to us and worked with us to identify the best and quickest path to listing within 2 weeks to take advantage of the low inventory conditions in our South Carlsbad neighborhood. They knew our tract specifically and had many previous sales there over the years - they came prepared with a thorough analysis of comparative sales and recommended a pricing strategy that they felt confident would yield offers the first weekend on the market.
The Great
Over the next two weeks Donna coordinated a range of vendors who she knew from experience could get the preparation to list work we needed done on time and with high quality. Our light tune-up involved excellent experiences with their stagers, landscapers, contractors, electricians, and plumbers. Throughout this period Donna's daily communication was clear, concise, and responsive. Any time we had questions Donna picked up the phone or texted immediately - but almost always, she answered our questions before we even knew we had them.
The Outstanding
We had a tricky situation with a shared fence that could have delayed our escrow. Donna used superb mediation skills to negotiate the terms of replacement and was personally on site with the fence contractor to make sure everything went smoothly. The fence looks great and escrow closed on time.
The Truly Exceptional
Our house came on the market on a Wednesday and between then and Monday morning Jim was personally at all three open houses. He was in constant communication explaining potential buyer reaction and strength. As he predicted offers began to come in on Saturday and each one was incrementally higher than the last. At the end we had 5 offers, 4 of which were over list, and the final accepted offer was $100,000 over list. In addition to being over list it included rent back terms that met our needs.
The Recommendation
For all of these reasons we would strongly recommend The Klinge Team to anyone wanting to sell in North County Coastal San Diego. I had been reading Jim's bubbleinfo.com blog for 15 years and knew when the time came to sell that he would be our first call. Jim Klinge is not your standard realtor. He is keenly aware of market conditions and sales strategies. And, works his tail off - though not as hard as Donna . At this point he's gone from realtor to friend and I plan to have him over to grill and chill at our new place to talk real estate, but also just about life and raising kids in San Diego. He's more interested in relationships than his sales numbers - and that's why his sales numbers are so high. We have already recommended the Klinge's to some close friends and another successful sale is on deck right around the corner...
Chris Shea
June 21, 2024
Trustindex verifies that the original source of the review is Google.
We recently had the pleasure of working with Jim and Donna from Klinge Realty Group to sell our house, and we couldn't be more satisfied with the experience. From the initial meeting, they listened attentively to our needs and provided invaluable guidance on specific improvements to get our home market ready.
Their responsiveness throughout the entire process was truly impressive. Anytime we had questions or concerns, they were quick to address them, ensuring we felt comfortable and informed every step of the way. What stood out the most was their team and extensive network of tradespeople, which made addressing any necessary repairs or updates seamless and stress-free.
Thanks to their expertise and dedication, our house sold quickly and at a great price. We highly recommend Jim and Donna to anyone looking to buy or sell a home. They are a fantastic team who truly care about their clients and deliver exceptional results.