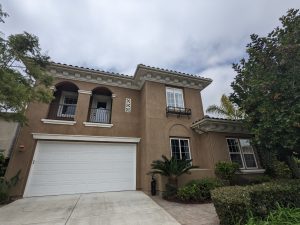
This film was taken on May 25th, a month after mortgage rates hit 5%.
I can’t wait to hear from the doomers who swear that because sellers had to take a whopping $50,000 haircut off the list price to sell this house to cash buyers who closed in two weeks (with sellers who wanted to occupy until August 1st), that this comp means the market is in trouble.
Would you pay almost $3,000,000 for this house, plus free rent?
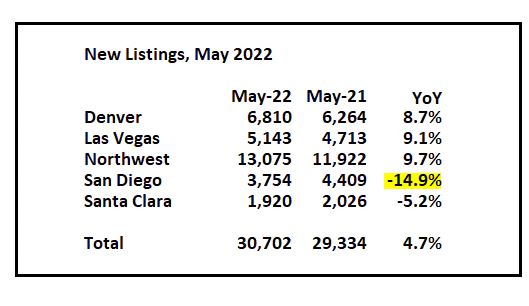
Here are two more charts from Bill that indicate how the San Diego market is bucking the national trend.
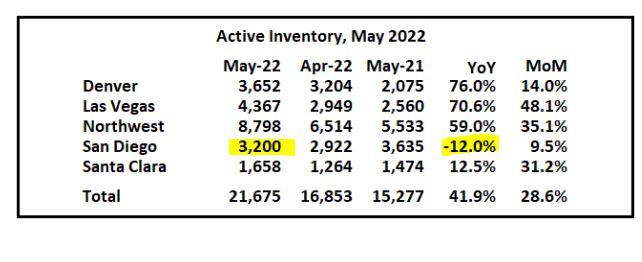
Compared to last year, our inventory keeps going down!
I don’t know what property types are included in Bill’s counts, but let’s use the SDMLS count for number of detached and attached homes sold in 2021, which was 39,671 / 12 = 3,305 average number of sales per month – but 2021 was a huge year.
What was the average in a fairly normal year? The 2019 average was 2,904 sales per month.
In San Diego County, we can expect 2,900 to 3,300 home sales per month.
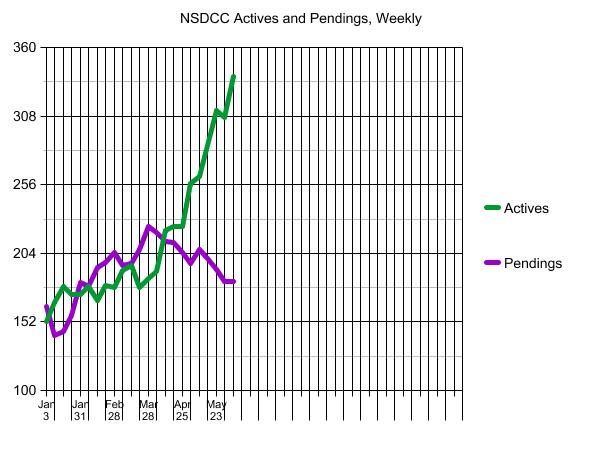
Look how many active listings there were last month (well into the 5%-rate era):
The market is being starved out. Other areas in the country are getting surges of inventory, but we’re not. Without a major surge, sellers can wait this thing out, and hope that buyers come around.
A few years ago, some friends appeared on a house-hunting reality TV show. They had a blast, but afterward, they revealed something that surprised me:
It was all staged. They’d already purchased a house when they filmed the episode, and that house wasn’t featured on the show at all. The houses they did look at weren’t even for sale.
Like any normal person, I accept that so-called “reality” TV is scripted to a certain extent, but I’d previously assumed there had to be some truth to those real estate shows: that the information they presented was somewhat reliable, and that you might be able to pick up at least some basics about real estate and home renovation from watching them.
The actual reality is: Nope.
Whether it’s a house-hunting show, a home renovation show, or a house-flipping show, the only thing you can rely on is that you’re probably being lied to. Buying or selling a house is more complicated than looking at three homes and having a conversation over a glass of wine, buying a fixer-upper probably isn’t a bargain, and the Property Brothers are not going to spend weeks in your house personally hanging drywall and grouting tiles.
But it’s worse than mere fakery—a lot of the information these shows give out is completely wrong. If you base your life decisions on what you see in real estate shows, you’re going to be very sorry. Here’s why.
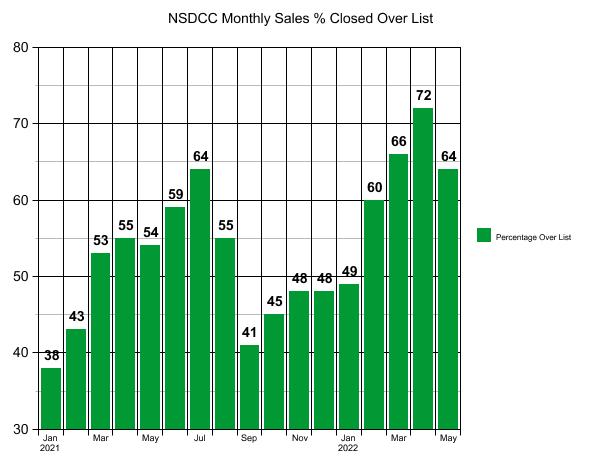
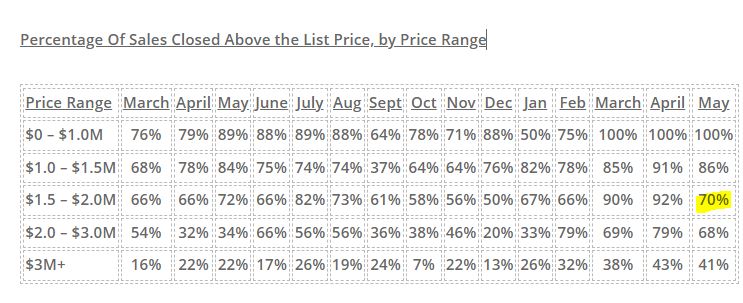
There was a slight decline in the percentage of sales closed over the list price in May, but it matched the peak month in 2021, and historically speaking, it still sounds wild that nearly two out of three buyers are paying more than the list price when we are at these crazy-high price points.
~~~~~~~~~~~~~~~~~~~~~~~~~~~~~~~~~~~~~~~~~~~~~~~
Here is how it breaks down by price range – the big decline was in one category:
NSDCC Average and Median Prices
Month
# of Sales
Avg. LP
Avg. SP
Median LP
Median SP
Feb
224
$2,298,797
$2,257,334
$1,719,500
$1,758,000
March
252
$2,295,629
$2,260,524
$1,800,000
$1,825,000
April
357
$2,396,667
$2,403,962
$1,799,900
$1,828,000
May
300
$2,596,992
$2,581,715
$1,900,000
$1,994,500
June
348
$2,509,175
$2,537,953
$1,900,000
$1,967,500
July
311
$2,421,326
$2,442,738
$1,795,000
$1,855,000
Aug
268
$2,415,075
$2,438,934
$1,897,000
$1,950,000
Sept
278
$2,479,440
$2,445,817
$1,899,000
$1,987,500
Oct
248
$2,754,470
$2,705,071
$1,899,000
$1,899,500
Nov
199
$2,713,693
$2,707,359
$1,999,000
$2,100,000
Dec
189
$2,686,126
$2,664,391
$1,985,000
$2,157,500
Jan
140
$2,828,988
$2,855,213
$2,234,944
$2,240,000
Feb
156
$3,058,406
$3,104,854
$2,149,500
$2,386,500
Mar
206
$3,254,033
$3,342,384
$2,425,000
$2,625,000
Apr
224
$3,205,239
$3,267,447
$2,372,500
$2,575,000
May
214
$2,941,080
$3,030,794
$2,350,000
$2,480,000
The average and median sales prices are dropping, but so are the list prices so it’s expected. The median sales price could dip another 13% and still be in positive territory for 2022!
Realtors are saying that the market is slowing, and Marc D. suggested that we define what that means:
A slowing market is when fewer active listings are priced to sell.
It is a result of…..
Fewer buyers – Higher mortgage rates priced out some or most of the buyers hoping to finance their purchase. They are simultaneously hoping for prices to come down to compensate, and/or in the process of making other adjustments like considering smaller homes, widening their target zone, or offsetting higher rates with bigger down payments or an adjustable-rate mortgage. All of which take time, so more buyers than ever are in the wait-and-see mode, which means…..
Fewer sales – as more buyers move to the sidelines, it’s disrupting the incredible sales flow we’ve enjoyed over the last two years where virtually every home that came to market has found a buyer with relative ease. A new listing that previously had an 80% to 90% chance of selling in the first week now has a 10% to 20% chance of selling that quickly (example: there are 345 NSDCC active listings today, and there were 33 new pendings in the last 7 days), which means…..
Longer market times – with more unsold homes lying around, it gives buyers the impression that the ‘slowing market’ could mean lower prices are coming, which makes them more cautious. The longer a home is on the market, the more pressure is on the seller to do more improvements, or lower the price. Or they can also choose a third option and just wait in line and hope that they are moving slowly up into the group of 10% to 20% of active listings that have a chance of selling this week. This option is dependent upon the newest listings being more optimistic on price than those unsold currently, but because they have more recent data available on the perils of over-pricing, the newer listings should be sharper on price, not worse.
A slowing market means we have transitioned from the one-time-in-history event where every home sold quickly, to the old reliable sellers-waiting-in-the-queue, hoping for their lucky day to come.
With only 10% to 20% of the actives selling each week, it is inevitable that the unsolds will start stacking up as both sides wait longer for their lucky day. For some sellers, that day will never come, and they will cancel their listing instead.
Knowing that sellers will still insist on getting their price or close, how can buyers and sellers both know how close a home is to selling?
List-Price Accuracy Gauge
If you are getting showings and offers, the list price is within 5% of being right.
If you are getting showings but no offers, the list price is 5% to 10% wrong.
If you aren’t getting showings, the list price is at least 10% wrong.
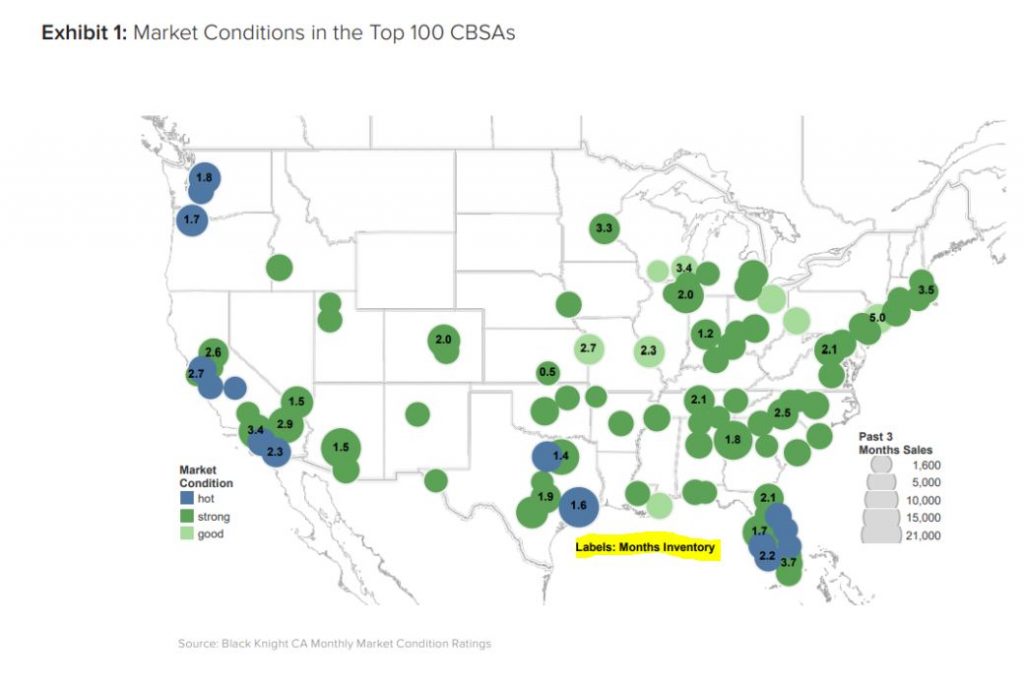
The best thing a seller can do is to lower their price so they at least get out of the bottom tier – you need to have showings to have a shot at selling. The market is still hot (see map at the top), there just aren’t as many active listings that are worthy of the attention of buyers. The sellers are still in control of the marketplace, and it will be their reaction to wrong pricing that determines the outcome – as measured by the sales count.
Back in the day (3-5 years ago), there were 10:1 actives to pendings in the high-end markets like Rancho Santa Fe, an area where sellers have always been content to wait as long as it takes. I’ll never forget the RSF listing agent who proudly asserted that her one-year anniversary of her listing was coming up! Some people don’t mind being on the open market and not selling – they are only motivated to move if they get their price, which is fine. Hope you get lucky!
Sellers will be hanging around for weeks or months, hoping the mythical market conditions improve and that lucky couple with 2.2 kids shows up, rather than go to work on their pricing. As their lease comes due or the start of school gets closer, the waiting buyers will anxiously decide whether they will step up and make an offer, or keep waiting for the mythical two-in-the-bush that might be a better value.
This is the Big Standoff whose intensity will be measured by the number of sales that find the sweet spot of being within +/- 5% of the latest pricing trend. The vast majority of sellers won’t sell for less, and buyers will be very reluctant to pay more than 5% above comps.
Once we got past the Memorial Day weekend, the unsold listings continued their climb. Here’s how the first week in June compares to previous years:
NSDCC Listings, First Monday in June:
Year
# of Active Listings
# of Pendings
# Actives Over $2M
# of Pendings Over $2M
2018
914
410
488
102
2019
1,005
365
523
85
2020
514
338
405
88
2021
607
360
270
166
2022
338
183
268
119
These are the stats from an ultra-low inventory environment, which we’ve never seen before. I’m sure there are sellers out there who haven’t had a showing yet. Consider the current market conditions, and act accordingly!
This listing hit the open market on April 18th, which was long after mortgage rates had gotten into the 5s. It went pending in the first ten days, but then it fell out of escrow three weeks later. By then, the doomer talk had escalated and reviving the market urgency would typically be more of a struggle.
They stuck with the $3,995,000 list price though, and another buyer snatched it up the next day and closed in two weeks at a slight discount of $3,850,000 cash:
There might be some turbulence in the marketplace being caused by the incessant doomer talk, but I haven’t seen any quality homes having to sell at a big discount yet.
Trustindex verifies that the original source of the review is Google.
Jim & Donna Klinge helped us sell our home of 30 years in Ocean Hills. We were very happy with their service and would HIGHLY recommend them to anyone looking for an Honest, Knowledgeable, Skilled, Informed Efficient realty team. Both Jim & Donna were so helpful in different ways and complemented each others skills. Please refer to a more detailed review that we wrote on YELP. Thank You Both for all your help!!!
Jesse O'Hara
June 12, 2025
Trustindex verifies that the original source of the review is Google.
A+ thank you
Lisa Tuomi
June 11, 2025
Trustindex verifies that the original source of the review is Google.
Many years ago, we purchased a home in Carlsbad, using a realtor that was recommended to us - Jim Klinge. Fast forward to 2025, we recently had the privilege of selling 2 homes in Carlsbad, CA and didn't hesitate to reach out to Jim and Donna Klinge of Klinge Realty Group to guide us through the sales. The transactions were very different, each with its own unique situation, opportunities and challenges. From start to finish, Donna and Jim helped navigate the pre-sale preparation, the listing, showing of the house, buyer negotiations, the final close and all of the paperwork and decisions in between. What stands out with both transactions is the professionalism of Jim and Donna (and their team), wonderful communication (timely, relevant, concise), their deep understanding of market dynamics (setting realistic expectations), their access to top-notch contractors, and last, their ability to guide us across the finish line successfully. We wouldn't hesitate to use Jim and Donna in the future and highly recommend them for anyone looking to buy or sell a property in North San Diego County.
Jerry Meyer
March 28, 2025
Trustindex verifies that the original source of the review is Google.
We sold a home with Jim and Donna and from beginning to end they were consummate professionals. Their initial walk through the property resulted in a list of items to be repaired or updated. They supplied a list of vendors and job quotes to do the repairs and updates. We originally wanted to sell ‘as is’ and just get it over with. They gave us a selling price for ‘as is’ and options for doing a few updates/repairs to doing it all with the selling price for each option. We agreed to do all they suggested and we sold for the exact price they predicted. For every dollar spent we got back more than $2 back in the selling price. And they got that price in a rising interest rate environment! Donna and Jim are extremely detailed and guide you through ever aspect of the sale. There were no surprises thanks to their guidance. We couldn’t be more pleased with their representation.
Thank you Donna and Jim,
Jerry and Mary
Heather Quejada
March 27, 2025
Trustindex verifies that the original source of the review is Google.
We have known Jim & Donna Klinge for over a dozen years, having met them in Carlsbad where our children went to the same school. As long time North County residents, it was a no- brainer for us to have the Klinges be our eyes and ears for San Diego real estate in general and North County in particular. As my military career caused our family to move all over the country and overseas to Asia, Europe and the Pacific, we trusted Jim and Donna to help keep our house in Carlsbad rented with reliable and respectful tenants for over 10 years.
Naturally, when the time came to sell our beloved Carlsbad home to pursue a rural lifestyle in retirement out of California, we could think of no better team to represent us than Jim and Donna. They immediately went to work to update our house built in 2004 to current-day standards and trends — in 2 short months they transformed it into a literal modern-day masterpiece. We trusted their judgement implicitly and followed 100% of their recommended changes. When our house finally came on the market, there was a blizzard of serious interest, we had multiple offers by the third day and it sold in just 5 days after a frenzied bidding war for 20% above our asking price! The investment we made in upgrades recommended by Jim and Donna yielded a 4-fold return, in the process setting a new high water mark for a house sold in our community.
In our view, there are no better real estate professionals in all of San Diego than Jim and Donna Klinge. Buying or selling, you must run and beg Jim and Donna Klinge to represent you! Our family will never forget Jim, Donna, and their whole team at Compass — we are forever grateful to them.
Lou F
March 27, 2025
Trustindex verifies that the original source of the review is Google.
WeI had the pleasure of working with Klinge Realty Group to sell our home in Carmel Valley, and I cannot recommend them highly enough!
Jim and Donna demonstrated exceptional professionalism, offering expert guidance on market conditions and pricing strategy, which resulted in a quick and successful sale.
Communication was prompt and we were well-informed throughout the entire process.
For anyone looking for a dedicated and knowledgeable real estate team, look no further!
---
William Sams
March 25, 2025
Trustindex verifies that the original source of the review is Google.
Donna and Jim Klinge of Klinge Realty Group have our highest possible recommendation. From Donna and Jim’s first visit to our house through closing their advice and counsel was candid and honest in all dealings. They kept us fully informed throughout the process. The house sold less than three days after listing with a two-week closing. My wife and I have sold several houses during our lives. This was by far the best experience. Klinge Reality is a premium service realtor. You can’t make a better choice for someone to sell your home fast and for top dollar.
Emily Hernandez
December 29, 2024
Trustindex verifies that the original source of the review is Google.
Donna and Jim provided exceptional support and professionalism throughout the entire process. We couldn't have been happier with their efforts. They made our house shine, and thanks to their expertise, it sold above the listing price in the very first weekend! Truly a fantastic experience from start to finish.
Jesus Adrian Sahagun
November 11, 2024
Trustindex verifies that the original source of the review is Google.
This year has been difficult on our family, mainly due to having to sell our home. Thankfully we knew God had a plan for us and working with the Klinge team was a key part of it. It was an obvious decision to work with them again after such an amazing experience when purchasing the same home we needed to sell. The challenge was, how will we do this in so little time with so much going on? Jim and Donna held our hand every step of the way. Whenever an unexpected issue arose they found and provided a solution. Never once did we feel pressured to make a decision and the Klinges were always reassuring after providing the information that the decision was ours to make. Despite the curve balls, they never panicked and exemplified the “can do” attitude, making us feel optimistic and taken care of. Their expertise and professionalism was superb. But of all the reasons to work with the Klinges, the most impactful and valuable is their compassion and genuine care for their clients. We pray that we can one day purchase our forever home and you better believe that Jim and Donna will be representing us - as long as they will have us of course. Thank you again Klinge team! Your execution, experience, and care are unmatched.
SABIHA PASHA
July 23, 2024
Trustindex verifies that the original source of the review is Google.
Jim and Donna were fantastic! Jim understanding my needs, recommending potential places, pointing out the pros and cons of each property was invaluable. Then when the offer was accepted Donna’s organized guidance through the inspections, paperwork etc made the whole process seem effortless.
So grateful that I had them on my side!