

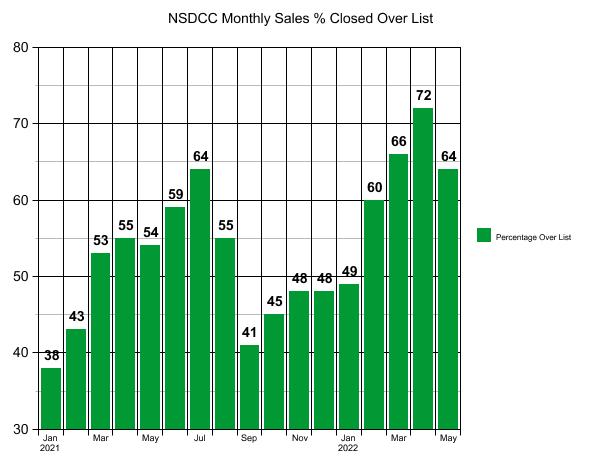
There was a slight decline in the percentage of sales closed over the list price in May, but it matched the peak month in 2021, and historically speaking, it still sounds wild that nearly two out of three buyers are paying more than the list price when we are at these crazy-high price points.
~~~~~~~~~~~~~~~~~~~~~~~~~~~~~~~~~~~~~~~~~~~~~~~
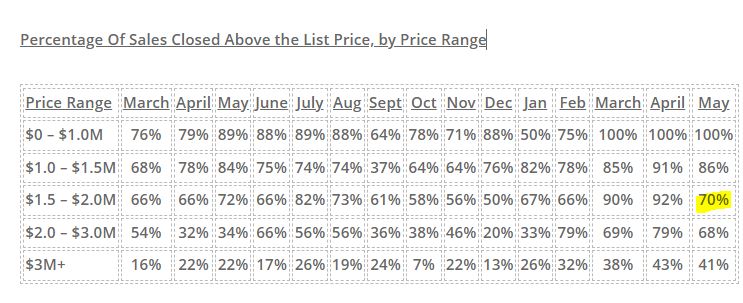
Here is how it breaks down by price range – the big decline was in one category:
NSDCC Average and Median Prices
| Month | |||||
| Feb | |||||
| March | |||||
| April | |||||
| May | |||||
| June | |||||
| July | |||||
| Aug | |||||
| Sept | |||||
| Oct | |||||
| Nov | |||||
| Dec | |||||
| Jan | |||||
| Feb | |||||
| Mar | |||||
| Apr | |||||
| May |
The average and median sales prices are dropping, but so are the list prices so it’s expected. The median sales price could dip another 13% and still be in positive territory for 2022!
~~~~~~~~~~~~~~~~~~~~~~~~~~~~~~~~~~~~~~


0 Comments