It would have been a good idea to launch the auction format on an industry-wide basis during the frenzy. But how about now? They are still a good idea because auctions bring transparency and certainty to the home-buying process, which buyers would appreciate and make them more likely to engage. Excerpts from article linked below:
If a home has been listed for a long time without much interest, it may be overpriced, according to Mr. Lesnock. During the pandemic, heightened demand has created bidding wars among buyers, with some prime properties selling within days of listing. If a residence isn’t getting any traction in one of the hottest real estate markets of the modern era, there’s a problem.
“Why is it not selling? It’s the windiest day on record, why is this kite not flying, right? That’s the way to think about it,” Mr. Lesnock explained.
The auction process also allows more transparency, according to Mr. Pchelintsev. Both buyers and sellers can follow the bids, either at a live auction or, increasingly, online.
“You get a notification on your phone. Someone just made a bid bigger than you, and you go, ‘how dare you?’” he said. “You go on and place a bigger bid and now you’re basically, apart from trying to get this amazing house, you’re also In sort of a little bit of a competition.”
That competition can help drive up the price of the property, according to Randy Haddaway, CEO and founder of Naples, Florida-based Elite Auctions.
“Sellers get more through this process than they would otherwise,” he said. “You get a group of millionaires competing against each other—and none of them are used to losing. They don’t want to walk away and that drives up prices.”
Mr. Lesnock agreed. “If you do [an auction] correctly, it will generate fair market or better prices.”
When we listed 365 Marine Street in La Jolla for $6,950,000, the price was very aggressive at $2,401/sf. A top agent called it ‘oceanfront pricing’. Here’s the strategy I employed to sell for top dollar at minimum risk!
Here is my home tour:
This was my tour of the super-custom features in the home:
It is so great having Kayla home. She grew up as a San Diegan, but she is a New Yorker now, living just blocks away from Times Square. Alicia was born in New York City, but is a La Jollan now and one of the 100 Greatest Artists of All-Time, having sold over 90 million records and winner of 15 Grammys!
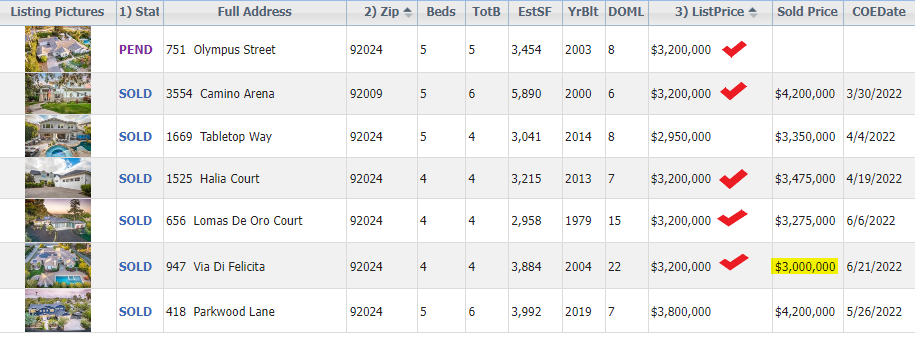
After she took five listings at the same price, I joked with the listing agent here that maybe every house was worth $3,200,000 now! I don’t think any of them were worth $3 million before this year, and this is the only one that has closed under list:
Hat tip to long-time reader Todd who we saw at the game last night – we did bug out early, but it was only to pick up Kayla at the airport. The Padres walked it off in the 11th inning!
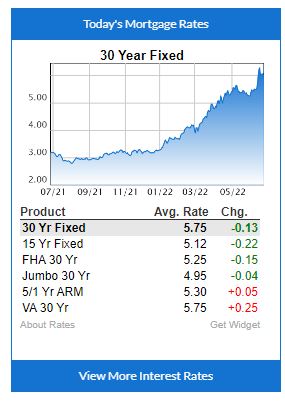
Meanwhile, people are wondering where the local real estate market is going to end up.
For conditions to change much, sellers would have to panic, and dump on price. Otherwise, we will just be taking a leisurely stroll through Plateau City, admiring all the homes that aren’t selling.
Here are the favorite zip codes around North County – SE Carlsbad (92009), Encinitas (92024), Carmel Valley (92130), and Rancho Santa Fe (92067).
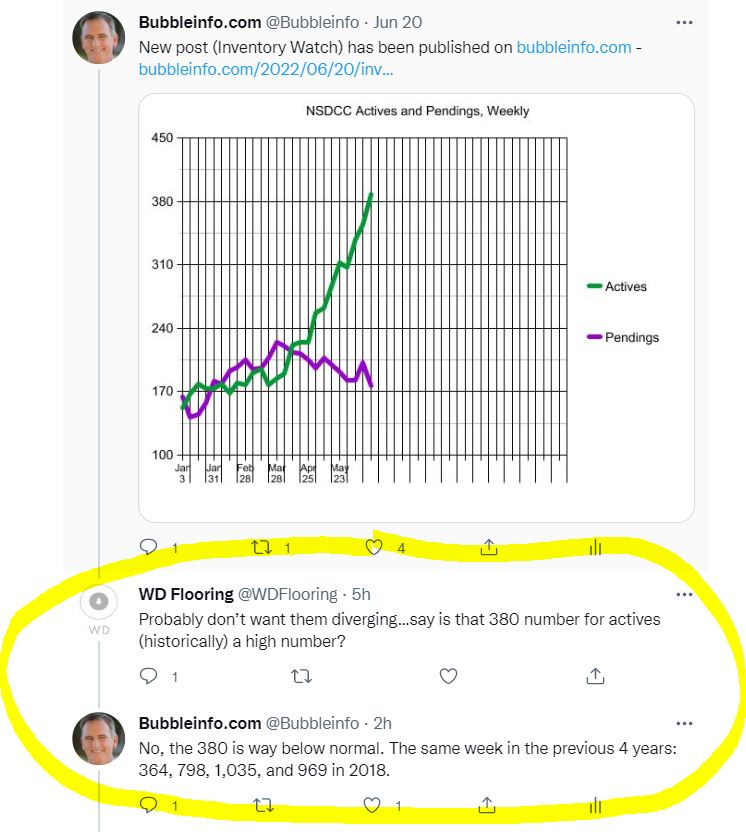
A few months ago, we had the lowest number of active listings of all-time:
While lately the number of the active listings have been growing steadily, they would have to double from this point before getting into the danger zone – but we’re going to run out of time before that happens.
Now that doom is being broadcast everywhere, sellers will decide that ‘now isn’t a good time to sell’, and by August they will quit listing their homes for sale.
There are 396 NSDCC active listings today (and 180 pendings), and we might hit 500 before August, but that will be the peak for 2022.
The market won’t keep getting worse – it will just taper off for rest of the year as buyers AND sellers lose interest. Instead, we’ll be talking about the playoffs and our first-place Padres going to the World Series!
We are having fewer sales between Carlsbad and La Jolla, but about the same percentage are closing over the list price as we’ve seen in the previous months of 2022:
NSDCC Detached-Home Sales, June (Month-to-Date)
Number of Sales: 104
Number of Sales Closed Over List: 68 (65%)
Average List Price of Over Lists: $2,298,732
Average Sales Price of Over Lists: $2,448,509
SP:LP = 107%
Median List Price of Over Lists: $2,100,000
Median Sales Price of Over Lists: $2,267,500
SP:LP = 108%
Can we say that the list pricing has come down much? Not really.
The median days-on market of those that closed over list was 8 days, so pretty much all of the buyers were into the higher mortgage-rate era when they made their decision.
I know it’s tempting for waiting buyers to think it’s going to get better, later – but so far, all that’s happened is fewer sales.
The Beach-Barber Tract is probably my favorite neighborhood in La Jolla, and is an eclectic mix of new and old that are close to both the beach AND village. A block down from our sale is this teardown that just sold for $6,000,000. The seller also owned the house next door to it, and he was the one who bought Mitt’s home – and just moved across the street!
Let’s break down the active and pending listings by zip code is to give you a closer look at the neighborhood stats. We’re going to have more active listings simply because the the list prices were all based on red-hot frenzy conditions (comps + 5% or more), and we’re past the red-hot days.
NSDCC Actives and Pendings
Town/Area
Zip Code
Feb 27
Mar 16
May 5
Jun 20
Cardiff
92007
5/7
6/4
7/7
13/5
Carlsbad NW
92008
6/9
8/10
15/10
27/10
Carlsbad SE
92009
15/29
8/33
20/27
47/25
Carlsbad NE
92010
1/5
2/6
7/14
17/11
Carlsbad SW
92011
2/11
4/12
8/16
19/19
Carmel Valley
92130
10/31
10/30
22/25
50/18
Del Mar
92014
15/32
17/10
24/13
30/8
Encinitas
92024
15/32
17/28
24/32
46/26
La Jolla
92037
53/38
55/35
51/32
72/24
Rancho Santa Fe
92067
45/22
47/24
49/22
52/25
Rancho Santa Fe
92091
2/2
5/2
2/0
3/2
Solana Bch
92075
6/6
3/10
9/7
12/5
NSDCC
All Above
179/205
182/204
238/205
388/178
The selling season started early in 2022, and was cooking by the end of February. Let’s group the different areas based on how their pendings are holding up.
Frenzy-ish:
Carlsbad SW – A few houses finally went up for sale, and buyers responded.
Rancho Santa Fe – The active listings aren’t growing like in the other high-end areas of Del Mar and La Jolla, and the number of pendings are very impressive. It was once normal when the Ranch had a 10:1 ratio between actives and pendings!
Normal-ish:
Everyone else, except……
Crash Zone
Carmel Valley – which has always had more pendings than actives over the last two years – and sometimes twice as many pendings! While having 50 actives and 18 pendings anywhere else would be a win, in the CV it feels like a meltdown.
Here they are:
(I tried to sort those by price order, but all they have is sort by date added)
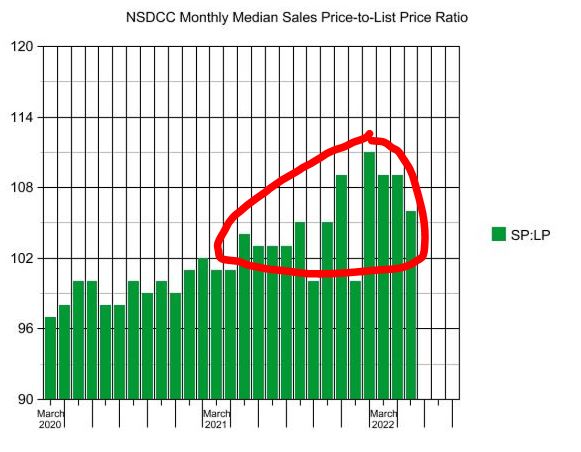
This nonsense about every buyer paying way over list price has to stop. If the SP:LP was around 100% we’d be elated, yet it was 111%, 109%, and 109% in the February-April stretch.
So far in June, the SP:LP is 107% for the 104 detached-home sales between Carlsbad and La Jolla!
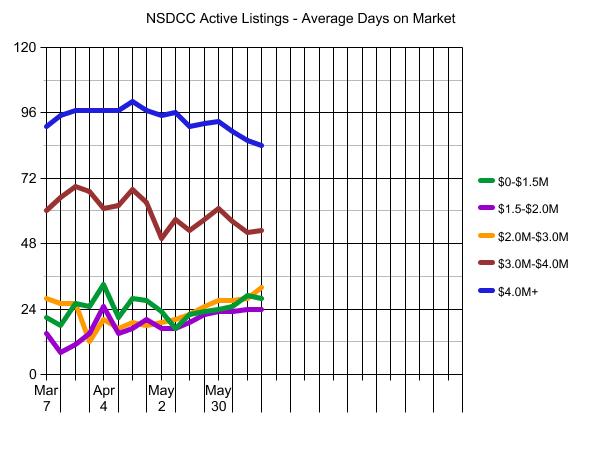
We can also track the average market times too. Any upward trends here would indicate market slowing – it’s early so nothing too startling yet:
The hottest of the red-hot was in 2020, when we had 400+ pendings from June 22nd to November 30th – with a peak of 491 pendings on 9/7/2020. Today we have 178 pendings.
Trustindex verifies that the original source of the review is Google.
Jim & Donna Klinge helped us sell our home of 30 years in Ocean Hills. We were very happy with their service and would HIGHLY recommend them to anyone looking for an Honest, Knowledgeable, Skilled, Informed Efficient realty team. Both Jim & Donna were so helpful in different ways and complemented each others skills. Please refer to a more detailed review that we wrote on YELP. Thank You Both for all your help!!!
Jesse O'Hara
June 12, 2025
Trustindex verifies that the original source of the review is Google.
A+ thank you
Lisa Tuomi
June 11, 2025
Trustindex verifies that the original source of the review is Google.
Many years ago, we purchased a home in Carlsbad, using a realtor that was recommended to us - Jim Klinge. Fast forward to 2025, we recently had the privilege of selling 2 homes in Carlsbad, CA and didn't hesitate to reach out to Jim and Donna Klinge of Klinge Realty Group to guide us through the sales. The transactions were very different, each with its own unique situation, opportunities and challenges. From start to finish, Donna and Jim helped navigate the pre-sale preparation, the listing, showing of the house, buyer negotiations, the final close and all of the paperwork and decisions in between. What stands out with both transactions is the professionalism of Jim and Donna (and their team), wonderful communication (timely, relevant, concise), their deep understanding of market dynamics (setting realistic expectations), their access to top-notch contractors, and last, their ability to guide us across the finish line successfully. We wouldn't hesitate to use Jim and Donna in the future and highly recommend them for anyone looking to buy or sell a property in North San Diego County.
Jerry Meyer
March 28, 2025
Trustindex verifies that the original source of the review is Google.
We sold a home with Jim and Donna and from beginning to end they were consummate professionals. Their initial walk through the property resulted in a list of items to be repaired or updated. They supplied a list of vendors and job quotes to do the repairs and updates. We originally wanted to sell ‘as is’ and just get it over with. They gave us a selling price for ‘as is’ and options for doing a few updates/repairs to doing it all with the selling price for each option. We agreed to do all they suggested and we sold for the exact price they predicted. For every dollar spent we got back more than $2 back in the selling price. And they got that price in a rising interest rate environment! Donna and Jim are extremely detailed and guide you through ever aspect of the sale. There were no surprises thanks to their guidance. We couldn’t be more pleased with their representation.
Thank you Donna and Jim,
Jerry and Mary
Heather Quejada
March 27, 2025
Trustindex verifies that the original source of the review is Google.
We have known Jim & Donna Klinge for over a dozen years, having met them in Carlsbad where our children went to the same school. As long time North County residents, it was a no- brainer for us to have the Klinges be our eyes and ears for San Diego real estate in general and North County in particular. As my military career caused our family to move all over the country and overseas to Asia, Europe and the Pacific, we trusted Jim and Donna to help keep our house in Carlsbad rented with reliable and respectful tenants for over 10 years.
Naturally, when the time came to sell our beloved Carlsbad home to pursue a rural lifestyle in retirement out of California, we could think of no better team to represent us than Jim and Donna. They immediately went to work to update our house built in 2004 to current-day standards and trends — in 2 short months they transformed it into a literal modern-day masterpiece. We trusted their judgement implicitly and followed 100% of their recommended changes. When our house finally came on the market, there was a blizzard of serious interest, we had multiple offers by the third day and it sold in just 5 days after a frenzied bidding war for 20% above our asking price! The investment we made in upgrades recommended by Jim and Donna yielded a 4-fold return, in the process setting a new high water mark for a house sold in our community.
In our view, there are no better real estate professionals in all of San Diego than Jim and Donna Klinge. Buying or selling, you must run and beg Jim and Donna Klinge to represent you! Our family will never forget Jim, Donna, and their whole team at Compass — we are forever grateful to them.
Lou F
March 27, 2025
Trustindex verifies that the original source of the review is Google.
WeI had the pleasure of working with Klinge Realty Group to sell our home in Carmel Valley, and I cannot recommend them highly enough!
Jim and Donna demonstrated exceptional professionalism, offering expert guidance on market conditions and pricing strategy, which resulted in a quick and successful sale.
Communication was prompt and we were well-informed throughout the entire process.
For anyone looking for a dedicated and knowledgeable real estate team, look no further!
---
William Sams
March 25, 2025
Trustindex verifies that the original source of the review is Google.
Donna and Jim Klinge of Klinge Realty Group have our highest possible recommendation. From Donna and Jim’s first visit to our house through closing their advice and counsel was candid and honest in all dealings. They kept us fully informed throughout the process. The house sold less than three days after listing with a two-week closing. My wife and I have sold several houses during our lives. This was by far the best experience. Klinge Reality is a premium service realtor. You can’t make a better choice for someone to sell your home fast and for top dollar.
Emily Hernandez
December 29, 2024
Trustindex verifies that the original source of the review is Google.
Donna and Jim provided exceptional support and professionalism throughout the entire process. We couldn't have been happier with their efforts. They made our house shine, and thanks to their expertise, it sold above the listing price in the very first weekend! Truly a fantastic experience from start to finish.
Jesus Adrian Sahagun
November 11, 2024
Trustindex verifies that the original source of the review is Google.
This year has been difficult on our family, mainly due to having to sell our home. Thankfully we knew God had a plan for us and working with the Klinge team was a key part of it. It was an obvious decision to work with them again after such an amazing experience when purchasing the same home we needed to sell. The challenge was, how will we do this in so little time with so much going on? Jim and Donna held our hand every step of the way. Whenever an unexpected issue arose they found and provided a solution. Never once did we feel pressured to make a decision and the Klinges were always reassuring after providing the information that the decision was ours to make. Despite the curve balls, they never panicked and exemplified the “can do” attitude, making us feel optimistic and taken care of. Their expertise and professionalism was superb. But of all the reasons to work with the Klinges, the most impactful and valuable is their compassion and genuine care for their clients. We pray that we can one day purchase our forever home and you better believe that Jim and Donna will be representing us - as long as they will have us of course. Thank you again Klinge team! Your execution, experience, and care are unmatched.
SABIHA PASHA
July 23, 2024
Trustindex verifies that the original source of the review is Google.
Jim and Donna were fantastic! Jim understanding my needs, recommending potential places, pointing out the pros and cons of each property was invaluable. Then when the offer was accepted Donna’s organized guidance through the inspections, paperwork etc made the whole process seem effortless.
So grateful that I had them on my side!