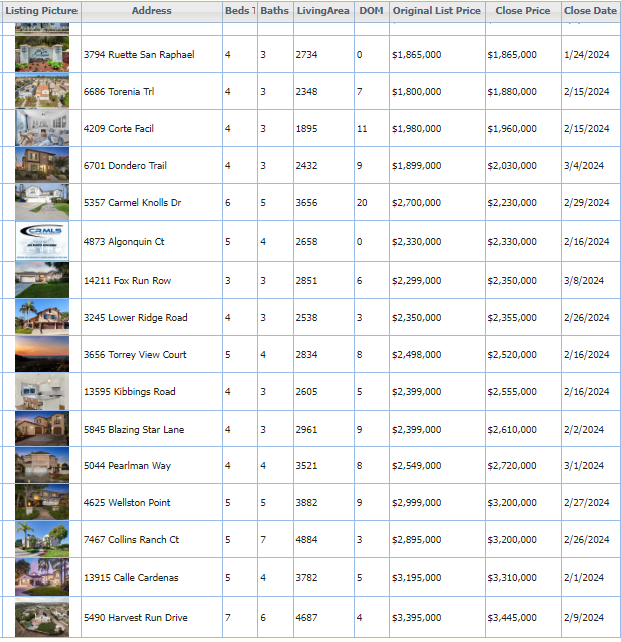
Above are the 2024 listings that have already closed escrow in Carmel Valley – it’s very competitive.
We’re heading into a new era where buyer-agents will be appreciated less than ever, if at all.
Consider this – in a bidding war where the sellers listing agent will be choosing between similar offers, won’t having a solid, reputable buyer’s agent on your side be helpful?
Not only will the buyer get strategic advice on making a more-lucrative offer, but the buyer-agent’s reputation will also play a role in the outcome. The listing agent will want to select a deal that has the best chance of closing easily, and their comfort and familarity with the buyer-agent will make a difference here in a tight race!
These are updated on the first of the month and are interactive:
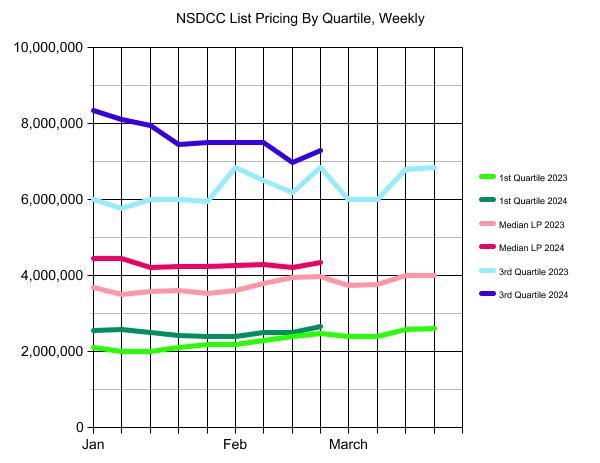
No real concerns there. The low volume causes the bumpy appearance, but for the most part, the pricing is fairly steady. If there were a downward trend for a few months, it would be different.
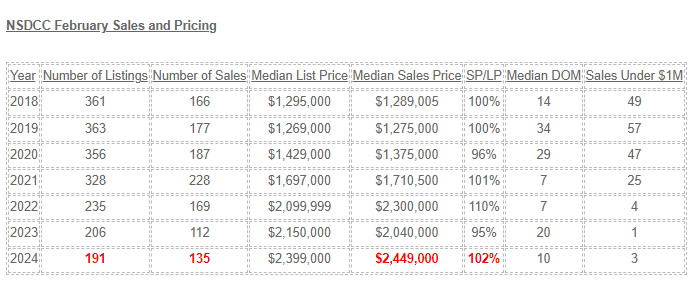
This month’s housing stats will benefit from an extra business day due to the leap year, but it will just be icing on the cake. The sales this month have already blown by last February, in spite of higher pricing.
I think we can say that we’re back to frenzy-like conditions:
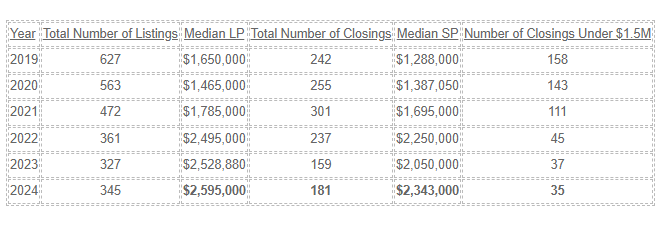
Some agents insist on inputting their listings of attached homes in the SFR category. There has only been ONE house sale under $1,000,000 in the last three Februarys.
This month’s total will probably be around 160-170 sales, which is phenomenal when you consider that we had similar monthly sales counts when pricing was half of what it is today! Not only that, but the number of sales will be close to the total number of listings too – probably closer than during the peak frenzy years.
With declining sales across the country, there are complaints about how bad the market has been, and people are wondering when it will get ‘better’. Better? This is great, relatively, and this is what we’re going to have for the next few years because the boomers are still relatively young (half are still working).
It will take a surge of new listings, and/or a drop in demand, which you’d think would happen naturally as prices go higher. But not yet.
How’s the flow of new listings?
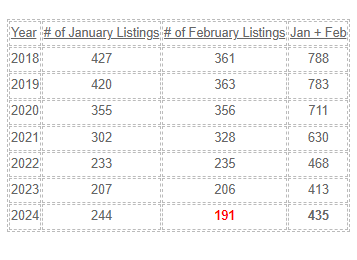
After a hot January that was +18% YoY, the February listings have cooled off – though there will be late-reporters that should get this year’s count up to 220-ish:
NSDCC Monthly Listings
Two months into the new year, I think we have found our groove. The inventory will stay low, and the special homes will keep blowing off the market – with the rest having to find their way.
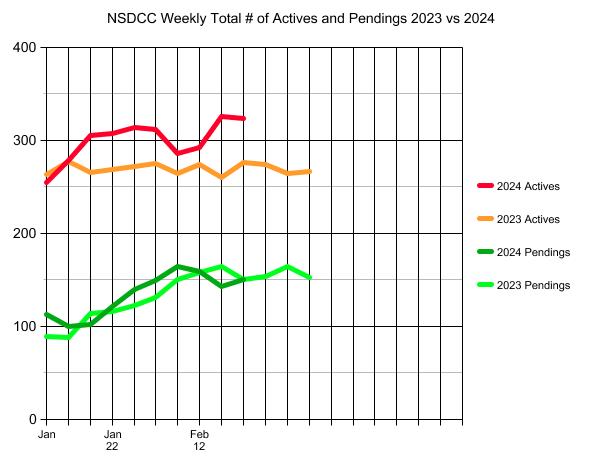
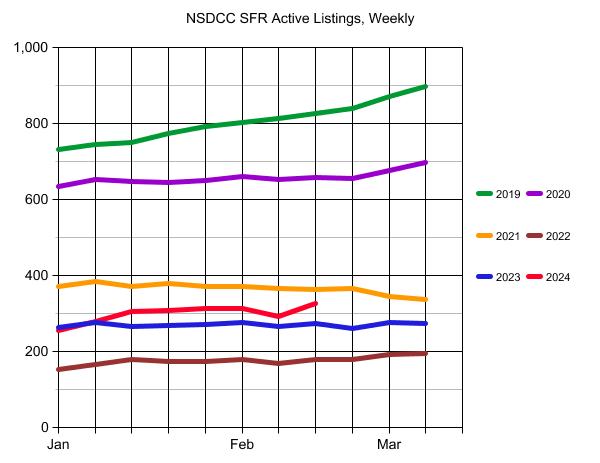
The blip in active listings over the last week isn’t too concerning and could just be from the weather.
The count of active listings is a good indicator of the demand though. During the mega-frenzy conditions from late-2020 through early-2022, you can see that the new listings were being gobbled up as quickly as they came on the market, and there was no build-up of the supply. Last year, the demand was hot enough in the early months that the active-listing counts were fairly flat too.
If this year’s count of active listings surges above 400, it will mean that we are exiting the frenzy days, and the market’s normalization is underway.
It is subject to the overall number of listings, and I’ll reuse yesterday’s chart to show the flow:
NSDCC Listings and Sales, Jan 1 – Feb 15
The total number of listings in 2024 is still in the frenzy range.
It’s the number of active listings that help demonstrate the velocity of the demand. Are they being gobbled up as fast as they hit the market like in recent years, leaving the number of actives fairly steady? Or are the actives starting to pile up, like they used to do? (see the 2019 green line in graph at top)
This is how we will know where the Spring Selling Season is going.
Buyers already have reason to be cautious and wait patiently because Powell opened his big yap and said he was going to lower his rate THREE times in 2024.
If the active listings break out of the frenzy range and start stacking up unsold, it will be irresistible for buyers to wait longer to see if sellers capitulate on price, while hoping rates might come down too.
Want to know where the market is going? Just watch the number/trend of the active listings!
On Monday morning, these were the counts of active and pending listings between La Jolla and Carlsbad:
Actives: 312
Pendings: 149
This morning, the counts are:
Actives: 286 (-26)
Pendings: 164 (+15)
These are pre-Super Bowl numbers and it’s been pouring rain for a week!
What’s going to happen once we get into the more-traditional selling season of March, April, and May?
These blog posts are uploaded onto my LinkedIn page, and it was there yesterday that Carl asked what my crystal ball said about pricing this year.
It’s going to keep going up!
The houses that aren’t well presented and are sloppy on price are going to sit. But those that have something special about them, and/or are presented well and have an attractive price are going to find a buyer in the first week or two.
NSDCC Supporting Data:
2023 Median List Price: $2,199,000
2023 Median Sales Price: $2,157,500
January, 2024 Median List Price: $2,200,000
January, 2024 Median Sales Price: $2,275,000
The median list price of today’s 164 pendings: $2,499,950
Some buyers are getting deals, mostly on the scratch-and-dent homes where sellers and listing agents didn’t do much, if anything, to prepare the home for sale. But look at the January median sales price – it’s higher than the median list price!
Here we go again!
We are already on our way to a +10% increase in pricing – and it’s only the first week of February!
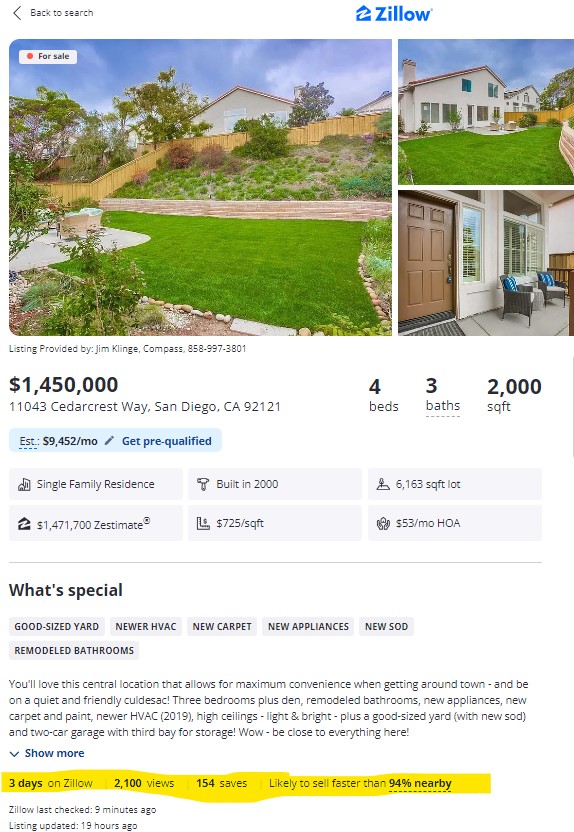
One house doesn’t speak for the whole market but it sure felt like it was already peak selling season this weekend. We had 160+ people attend, received eight offers so far, and it’s already $100,000+ over list:
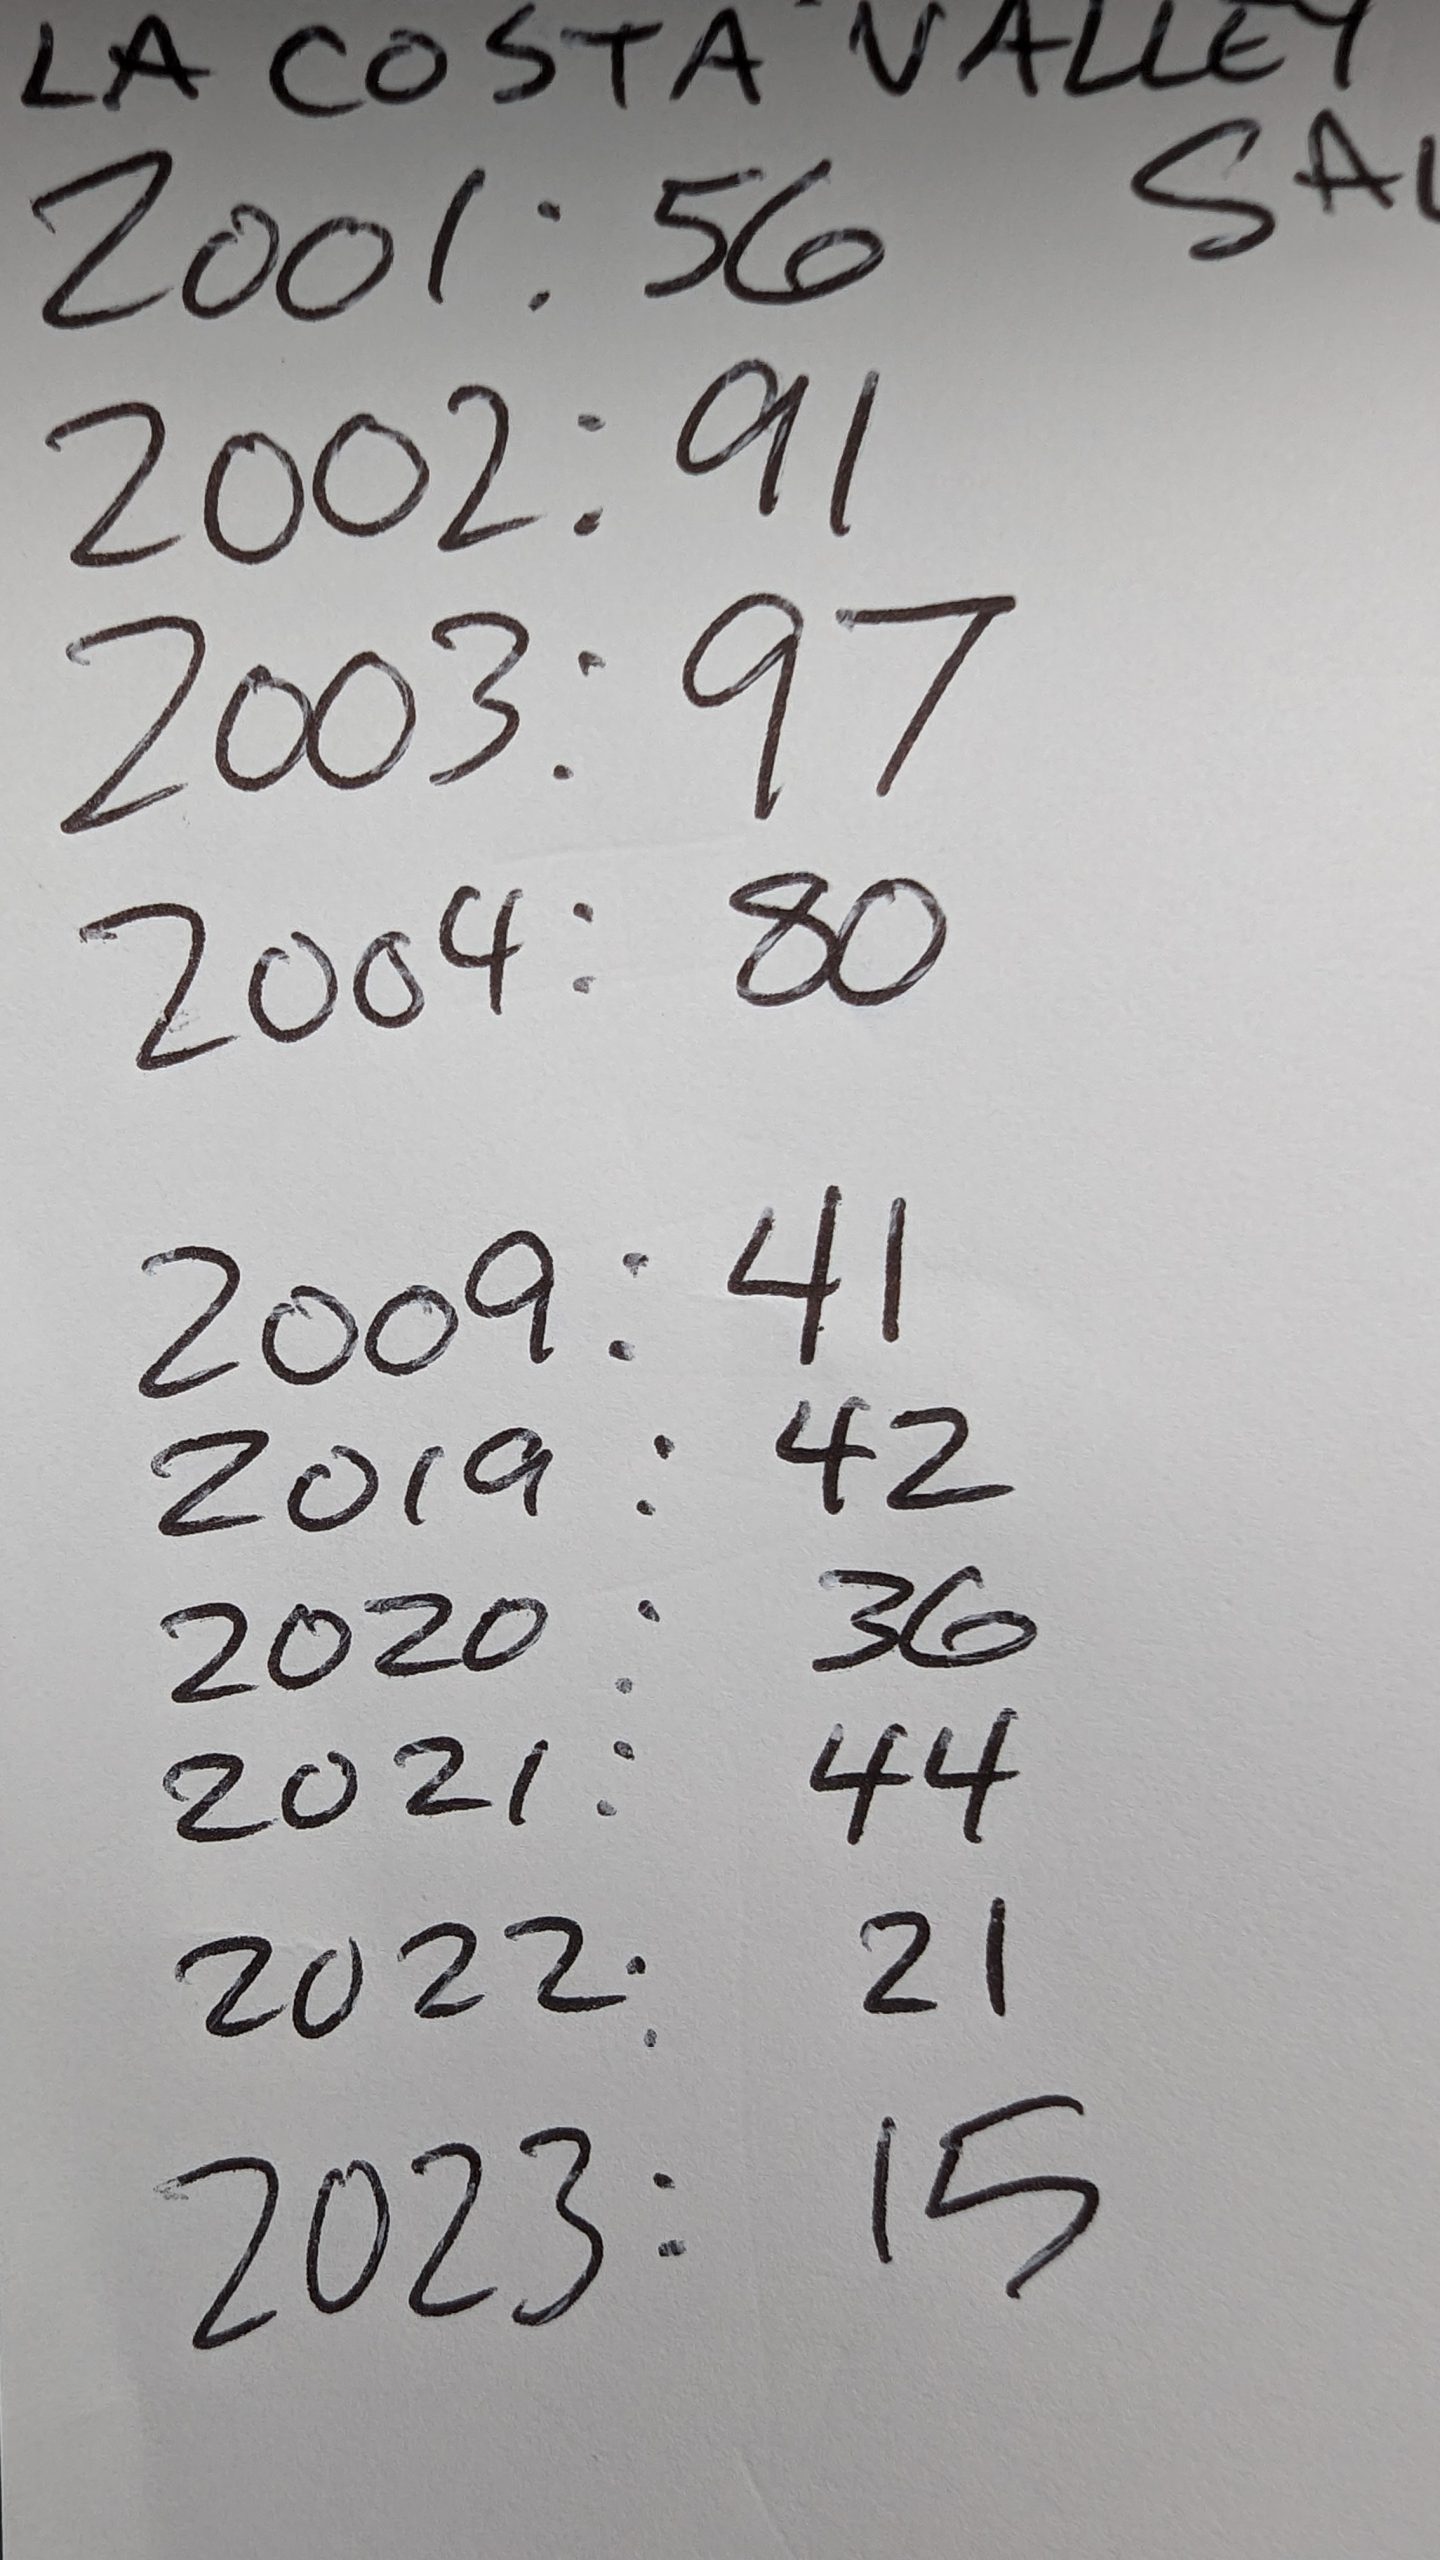
La Costa Valley (1,073 single-family homes) Annual Sales:
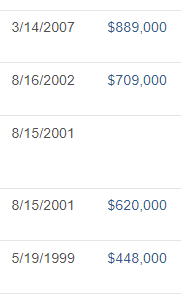
The new rule about getting profits tax-free went into effect in 1997, and it motivated people to move! The sales history of this house is an example of how it used to be – make a little money and be on your way:
But over the last 10-12 years, people stopped moving so much. Any of the original LCV homeowners were already empty-nesting, so it wasn’t the kids that kept them from moving. Rates were coming down a bit, and refinancing made it a little more affordable – and there wasn’t anywhere else to move locally that was better than what they had already.
Some may have thought that the 2007 buyer got left holding the bag. But he’s now listed for $2,085,000!