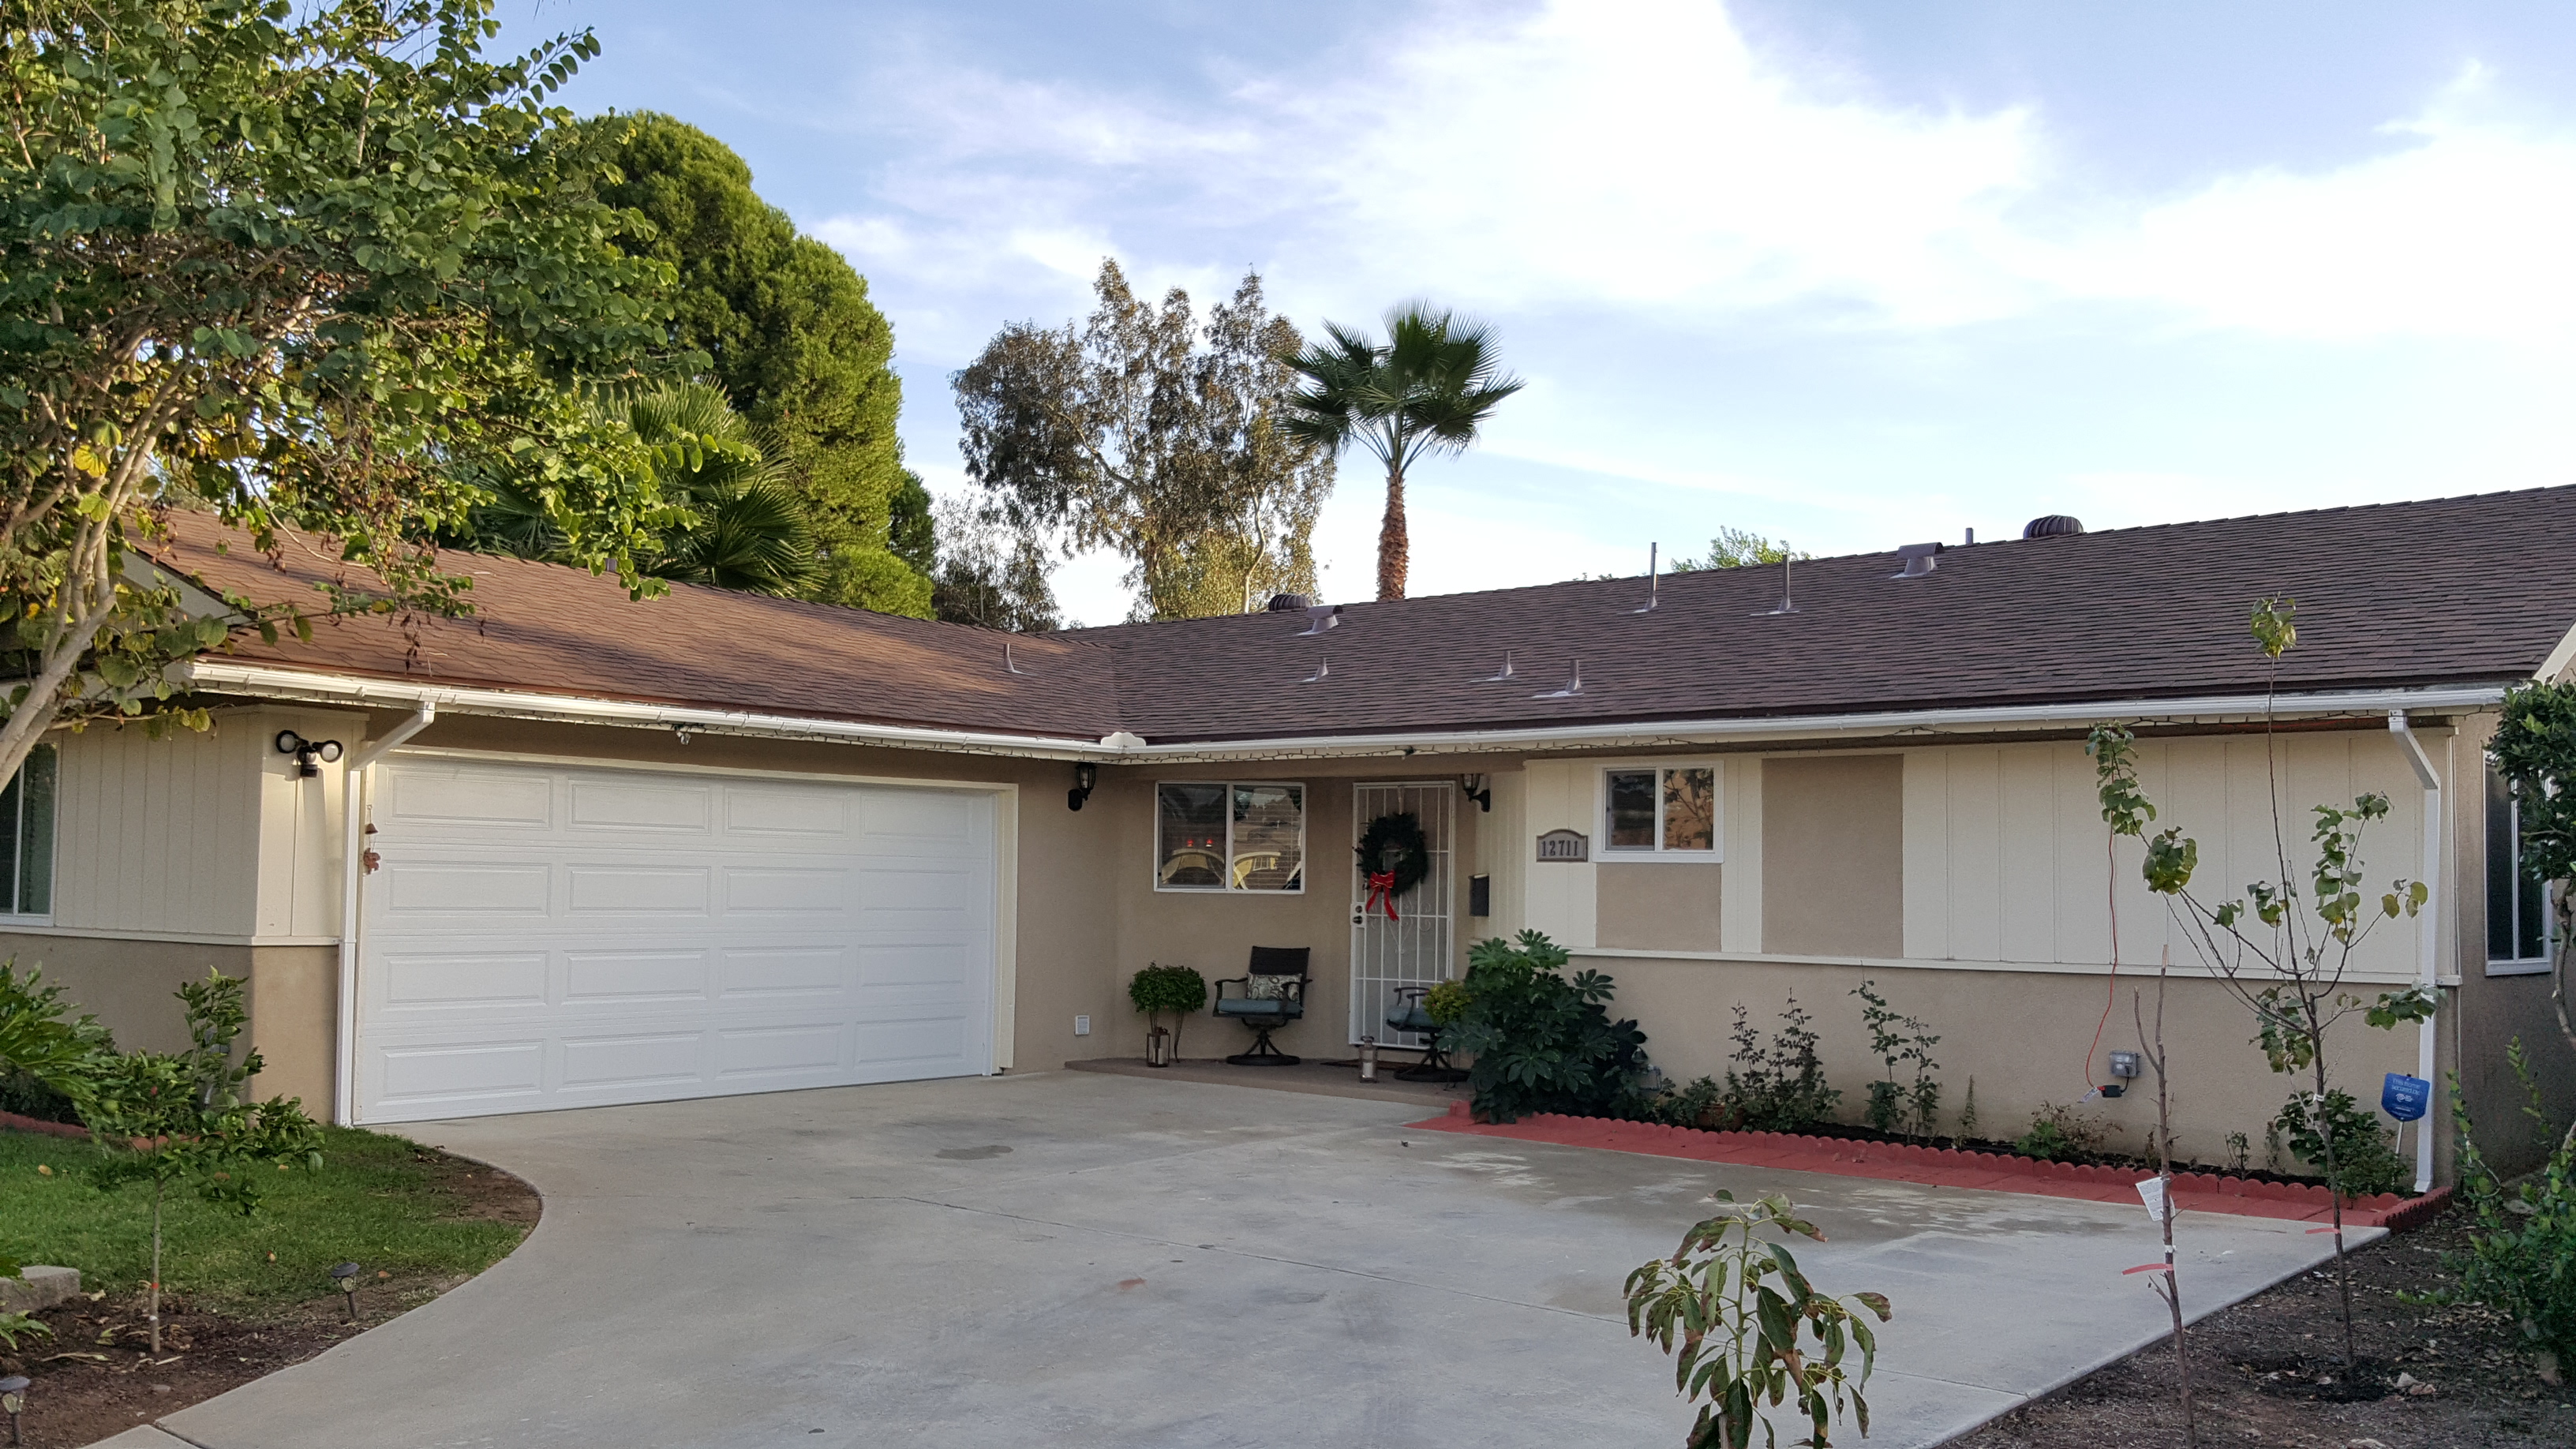
For those buyers looking for a fully-remodeled single story on the I-15 corridor (where the under-$600,000 inventory is thinning quickly), check out our new listing on Rios Road in Rancho Bernardo!
Most home sellers will try to sell their house for months (or years) before thinking their price might be wrong. As a result, there will need to be a long stagnant period before there is any chance of prices going down, market-wide.
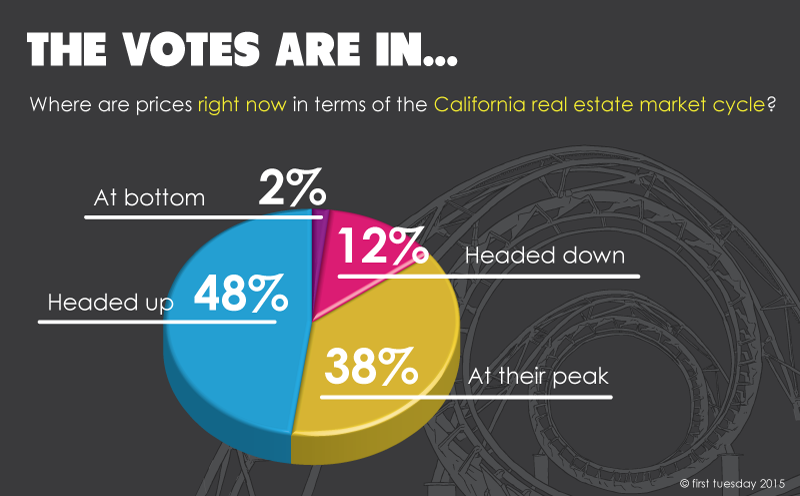
Are current home prices going to continue their recent upward trend, have they peaked or are prices in decline? Our readers are starting to lean toward a peaked home-price situation compared to their general beliefs one year ago.
In our recent poll, we asked where current real estate prices are headed. A solid 48% of readers believe prices are on their way up (a belief down from 55% one year ago). But in a shift from last year’s poll, 38% say prices have already reached their peak (one year ago 26% thought prices had peaked). Only 12% today think prices are going to drop (this was 18% last year).
In total, half of our readers believe prices are more likely to rise, while the other half does not expect prices to increase at all. A 50:50 split, signaling a shift as voters begin to see the price bounce from two years ago finally approach its end.
Unsurprisingly, predictions have altered course over the past year as prices have continued to climb but at a decelerated pace — perhaps prompting more readers to suspect the recent upward price trend is nearly over. In 2014, 56% of voters correctly predicted the continued price inflation.
These poll responses closely mirrored the actual trend as home prices did increase over the past year. However, today, readers are much less confident that home prices will continue their current inflationary path, now expecting prices to stagnate in the near future, or drop.
Nick Lowe and Los Straitjackets singing his biggest hit at the Belly Up tonight – love the guy in the front row taking in the action on his flip phone! (above)
After the last couple of years being fairly steady, it would be easy to expect more of the same in 2016 – tight inventory creating a seller’s market, especially for the superior properties.
Let’s at least examine how 2015 is winding down (now that Christmas is two weeks away!) to get a sense of how the new year will open up.
Thankfully, it looks like the active bin has been clearing out, and we’re down to 846 active listings today, which should set up a fairly clean slate to open 2016:
But let’s compare how the new listings/new solds are behaving. The new listings and sold don’t have a direct relationship, though some of the new listings will have closed escrow quickly enough to be included in the sold category too.
NSDCC New Listings and Solds between September 1 and November 30:
Year
New Listings
Sold Listings
2011
1,071
590
2012
911
827
2013
968
716
2014
976
652
2015
1,026
648
You can see that with higher rates and substantially-higher prices, we’re losing some steam here at the end of 2015 – more listings are hitting the market, but sales are slow to follow. We know that the new listings in 2016 will be packing an extra 5% to 10% to their price – anyone who has waited this long isn’t going to give it away!
But with an open playing field, won’t sellers demand their (higher) price? I think so, and the first quarter of 2016 should feel a little glutty as all players prefer a wait-and-see approach.
Last week we saw that there was a 17% surge in the number of new listings towards the end of this year, compared to 2014.
What is the effect on closed sales? The impact could go either way.
More well-priced listings could energize the market, and sales increase. Or a bunch of OPTs could cause buyers to wait and see.
It looks like a mix of both so far – November sales are up 6% year-over-year, and a few late-reporters could bump that a little higher:
Year
# of Sales
Avg. SF
Median SP
Avg. $/sf
Avg. DOM
2012
241
3,015
$885,000
$415/sf
80
2013
187
2,960
$1,030,000
$474/sf
58
2014
172
3,069
$1,007,450
$491/sf
57
2015
183
3,024
$1,187,500
$544/sf
54
The median sales price for November increased 34% since 2012, and the average cost-per-sf is up 31%.
I overhead a realtor comment that their manager thinks that people want to buy now before the new president gets elected. It made me think of the surprise surge of sales we saw during the last election at the end of 2012 that led to the Great Frenzy of 2013. The market could keep going – especially if we get a load of new listings that are well-priced!
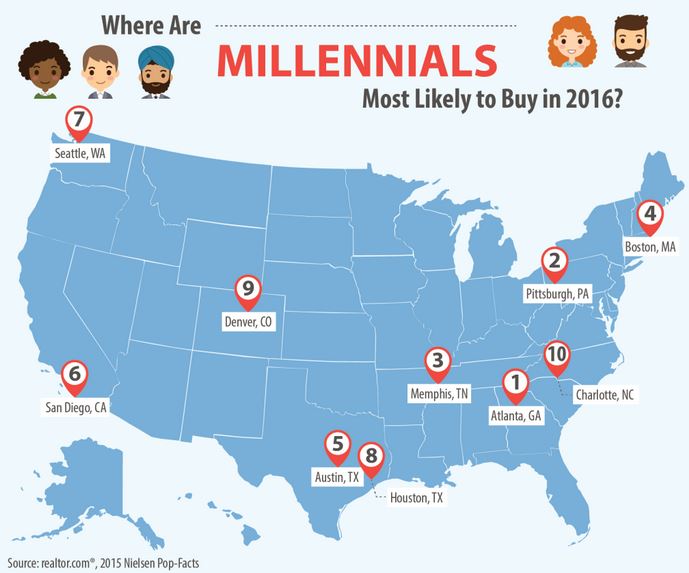
Is there any part of U.S. life that hasn’t been dramatically altered by the millennial invasion? This vast group of young Americans has already altered general perceptions of job place behavior, pop culture, media consumption, self-entitlement, and acceptable facial hair. But nowhere is its impact greater felt than in the housing market—and that impact is getting bigger all the time. Numbering 43.5 million, the older group of millennials (aged 25 to 34) makes up 13.6% of the U.S. population but fully 30% of the current population of existing-home buyers.
In 2016, millennials have the power to remake the real estate landscape wherever they choose to settle. But where will that be?
You might assume that young people are naturally drawn to the nation’s largest and most renowned metropolises such as New York City and Los Angeles to jump-start their careers and enjoy the full-throttle excitement of big-city life. And you’d be right—at least partly. But here’s the rub: Increasingly, they can’t afford to live in these places. Sure, Brooklyn may be a notorious hipster/millennial mecca, but how many 30-year-olds can afford $1.75 million one-bedroom co-ops? No wonder shrewd young home buyers are increasingly turning to cities that are relatively affordable and have lots of jobs and maybe even a trendy atmosphere all their own.
As part of the realtor.com® 2016 real estate forecast, we’ve pulled out our ironic Magic 8 Ball to prognosticate the top 10 markets likely to see a surge of millennial buyers. Get ready for an incursion of Sriracha, artisanal doughnut shops, and upscale tattoo parlors! And just to be fair, we also spotlight five places that seem to have lost their charm with the young generation and are likely to see the biggest exodus this coming year.
The ranking takes into our proprietary2016 Sales & Price projections the representation of millennial users among viewers of “for sale” listing pages on realtor.com from July to October, and the share of head of households aged 25 to 34 relative to all heads of households, from 2015 Nielsen Pop-Facts.
A strong economy led by the biotech industry, high-quality universities, year-round mild weather, gorgeous beaches with rich wildlife—do young people need more reasons to move to San Diego? No? OK.
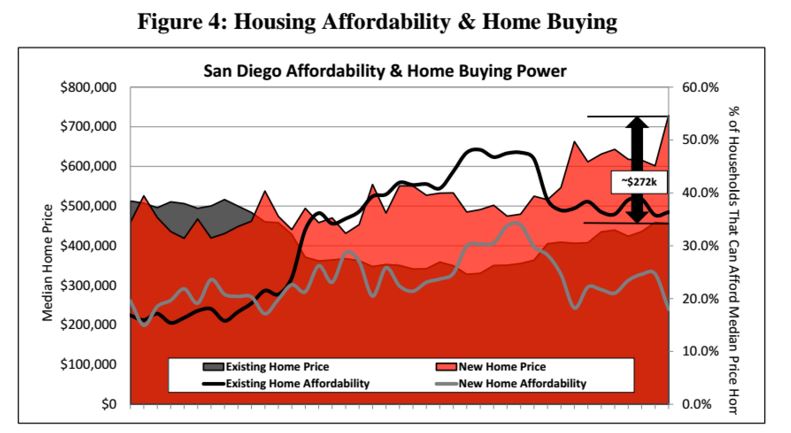
New homes and resales used to offer about the same median price and affordability in San Diego. But over the last few years, new-home pricing has jumped up substantially, eliminating some of the quality choices for buyers and delivering more demand to the resale market.
Read full report on the SD home-building market here:bit.ly/1SdBKnG
Click on the link below for the complete NSDCC active-inventory data:
We went to the escrow holiday party on Friday, and I just had to sneak in some business talk.
Are the new disclosures causing delays in escrow closings, and messing up the buyers’ plans for moving in?
The answer from an escrow officer that does purchases only (not refinances):
Closing delays prior to TRID: 20% to 30%
Closing delays since TRID: 60% to 70%
Lenders had months to prepare for TRID, and it has been in effect since October 3rd. Yet the majority of home sales are still being delayed due to disclosure problems. Why?
It’s mostly because TRID has strict timelines for the sending and receiving of the disclosures. The buyers cannot sign their loan documents until 3-10 days after the final disclosures are sent, and receipt acknowledged.
The disclosures are sent by loan-processing clerks who tend to be over-worked, and underpaid. If they work for a lender who does their share of refinances, then timelines become hazy because all that matters is closing before the rate-lock expires (nobody is moving in or out of the house with a refinance).
We had a closing last week where we represented the seller. The buyer had made it clear that they wanted to move in this weekend, and get settled before the holidays, which is understandable.
Donna (wifey) monitors the lender’s progress regardless of who we represent. It usually amounts to adult babysitting – some clerks don’t effectively manage their desk, they just respond to the requests of those who need them most.
It came down to the last day to send the disclosures in order to close on time, and the clerk rattled off the usual excuses – holidays, end-of-the-month, etc. – and wouldn’t make any promises about sending. Donna tactfully persuaded her to find a way, and she did. We closed on time!
It’s not the disclosures that are causing the delays, it’s the people involved!