Two reasons to cancel open house if an offer gets accepted that day (which locks the seller to this buyer):
1) Buyer’s remorse sets in immediately, so it keeps the buyers happier because I’m committing to them and they don’t feel like I’m shopping their deal around, and
2) Keeps open house attendees from resenting the tease of seeing the house but not being able to buy it.
It is sensitive, and I can see why many agents go ahead with their open houses in order to get more leads and potentially a backup offer – but they risk tipping over the buyers. We already saw how easy the last buyers cancelled, so I don’t want to shoot myself in the foot.
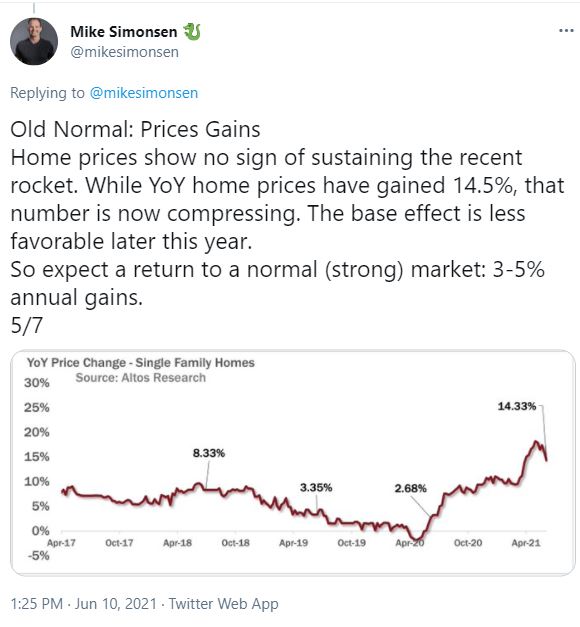
Mike thinks this year’s price explosion was unusual, and is working its way back to a more-normal pace. I agree with Mike, and think the market will split, with those products that have been the hottest (one-story homes, family homes with yards and pools, etc.) will stay red hot, while those on the fringes (inferior locations, condition, age, etc.) will struggle to keep up and their appreciation rate will flatten faster.
Here is his Twitter thread, and webinar – thanks Mike!
If you find a hot buy that is likely to have multiple offers, you will be confronting the uneasy choice of waiving the appraisal contingency in your offer. It’s likely that the other buyers will do it too, so it’s become a part of the minimum package needed just to compete.
If the appraisal comes in below the sales price and you have a 20% down payment or less, you will be forced to make up the difference in cash (or pay mortgage insurance, if possible).
In an unfortunate frenzy effect, because the appraisal contingency has been waived, listing agents don’t show up to help substantiate the value to the appraiser. It used to be one of the vital jobs of the seller’s agent to provide recent sales to the appraiser to ensure the appraisal came in at the sales price – so the sellers wouldn’t be faced with potentially having to lower the price to appease the buyers.
But these days, the listing agents couldn’t care less.
So now when we have the buyers, I meet the appraisers. I want to make sure I do everything I can to persuade the appraiser to hit the sales price so my buyers don’t have to bring in more money.
I just had one where, two days before our appraisal appointment, a new listing of a model-match but inferior condo hit the open market priced at 10% UNDER our sales price in an obvious ploy to start a bidding war. I already had a big challenge with the comps because there had not been a sale in the complex all year – and appraisers don’t like using sales from complexes that were 3-4 miles away.
But I convinced him, and the appraisal came in at our sales price!
Our listing in Fire Mountain is back on the market.
The buyers, who according to their agent were in love with the house and the price, decided to cancel because of what they found out about the city restrictions. The City of Oceanside won’t allow short-term rentals because the driveway is only 20 feet wide, instead of 24 feet wide. Long-term rentals are fine.
Though the short-term rentals are controversial and we really can’t predict their future, it was enough for the buyers to say no – they didn’t want any unusual restrictions that could possibly affect their kids’ future once they take over the house. The buyers had planned to live there for the duration.
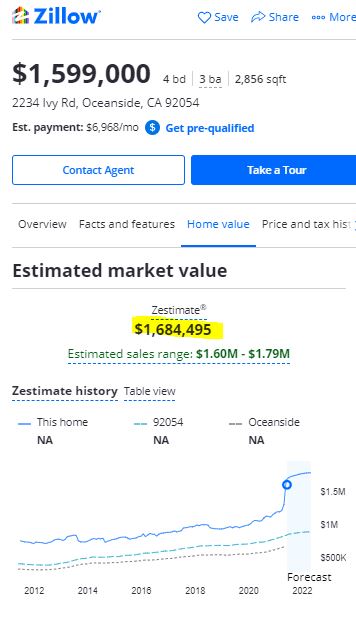
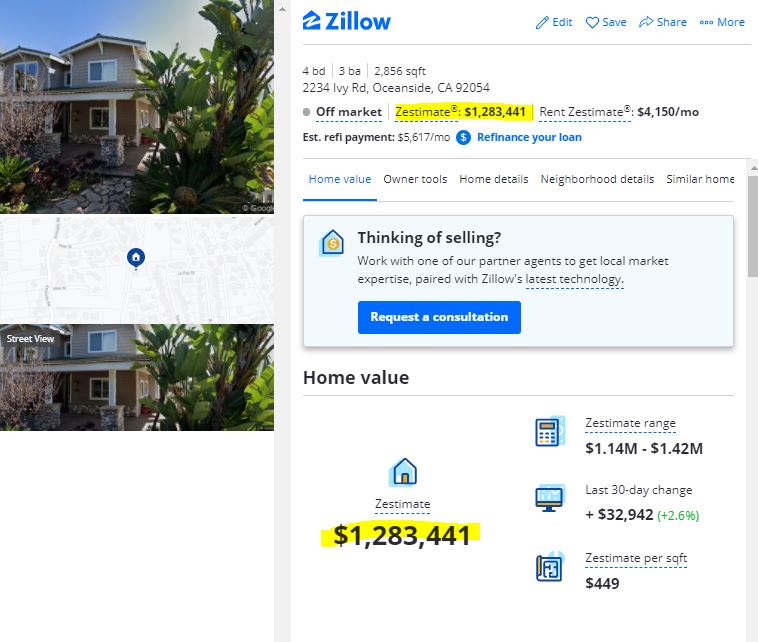
We are getting an assist from Zillow – their zestimate has gone up nicely since we hit the open market:
Here’s the zestimate from the day before the listing was inputted:
Because Zillow is buying homes in the area, it helps them to keep their zestimates artificially low. If they were legit, and kept the zestimate at the lower amount even though the list price was substantially higher, then fine – that’s your opinion. But when it fluctuates with the list prices, it’s a sham.
Because there is so little information available, the consumers rely on anything they can find, and the zestimates are the best-known valuations available – even though they can change by $400,000 in a day.
Here’s our two-week check on how the actives and pendings are faring.
The Big Three areas (Carmel Valley, Encinitas, and SE Carlsbad) remain blistering hot, and overall we are similar to how Ryan described the Sacramento market yesterday:
“We were driving 135 MPH, and now we’re down to 127 MPH”.
NSDCC Actives and Pendings
Town or Area
Zip Code
Actives/Pendings, Feb 2nd
May 12th
May 26th
June 9th
Cardiff
92007
11/16
9/12
10/11
8/14
Carlsbad NW
92008
17/19
19/30
19/23
20/24
Carlsbad SE
92009
9/38
19/60
13/57
19/49
Carlsbad NE
92010
1/12
5/13
6/13
8/14
Carlsbad SW
92011
2/17
8/16
4/17
4/19
Carmel Valley
92130
26/43
20/65
23/63
23/65
Del Mar
92014
43/13
34/26
34/26
32/20
Encinitas
92024
39/45
33/54
32/56
33/61
La Jolla
92037
101/46
82/40
87/47
88/48
RSF
92067
96/35
83/54
72/53
80/38
RSF
92091
–
3/7
1/6
3/6
Solana Beach
92075
11/10
6/9
7/8
12/6
NSDCC
All Above
356/294
321/386
308/380
330/364
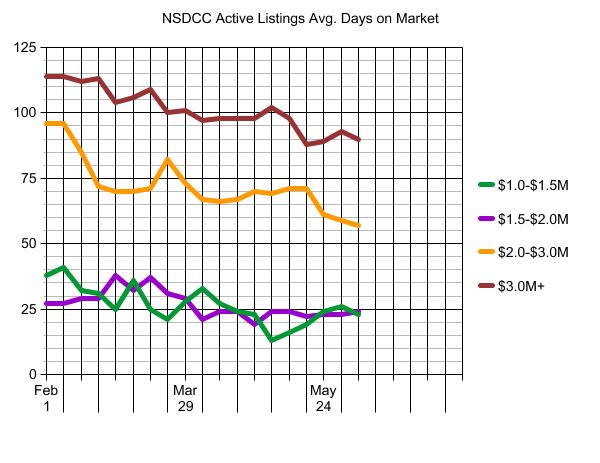
We can also track the average market times too. Any upward trends here would indicate market slowing:
These remain steady too, and an indicator that buyers are still jumping at the hot buys…and more!
Based on these closed sales, the local frenzy has been steady this year – though these are results of buying decisions made as far back as January and February.
For the most part, we have as many or more sales, and the same or higher LP:SP ratios over the last 60 days compared to the sales in the 60 days prior to April 23rd:
Detached-Home Sales By Zip Code
Town/Area
Zip Code
Sales 60 days Prior to April 23
LP:SP Ratio
Last 60 Days
LP:SP Ratio
Carlsbad NW
92008
40
103%
32
104%
Carlsbad SE
92009
95
105%
118
106%
Carlsbad NE
92010
15
105%
22
106%
Carlsbad SW
92011
29
103%
29
106%
Encinitas
92024
87
103%
92
104%
Carmel Valley
92130
72
101%
88
101%
This shows that the frenzy trends have been fairly consistent so far this year. Tomorrow we’ll take another look at the active and pending counts to see if there is any drop-off in the works.
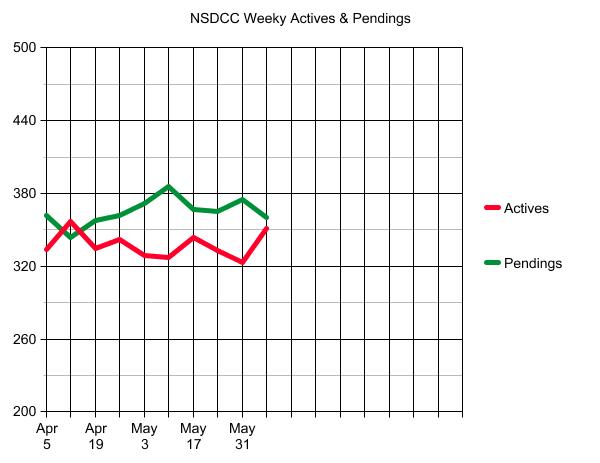
It is extremely unusual to have more pending listings than actives – I can’t remember a time when it has ever happened before, and certainly not at these record prices.
You can tell your grandkids that you remember when!
This week, we did have the lowest number of new pendings since January, and if these two lines cross again and and we go back to 1:1 or even 1.5:1, it won’t be panic time! A ratio of 2:1 is ‘normal’.
Today’s median list price for the active listings is $3,795,000, and for the pendings it’s $1,950,000.
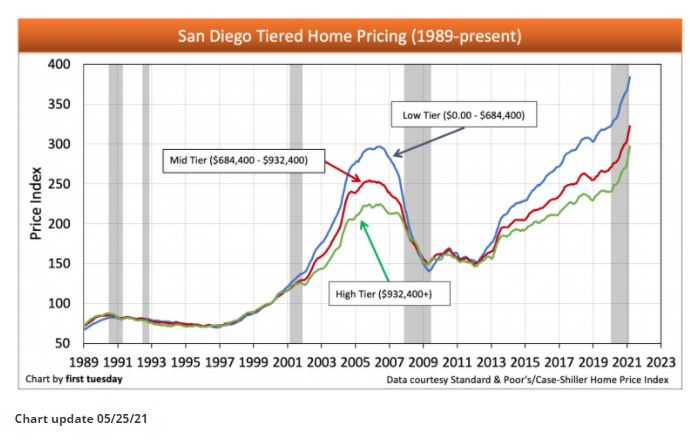
This graph is charting the local Case-Shiller Index. The latest reading is from March, so these trends are reflecting the first quarter of 2021 – which means these lines will be going straight up for at least another 2-3 readings before there is any chance of a change.
The editors expect a collapse in prices next year, though they are coming to the wrong conclusions:
The 2003-2007 era was goosed by increasingly-easier financing each year, so using those years as a gauge wouldn’t be accurate (financing has never been so tough to get now).
But the 2013 frenzy lasted for about a year – as long as we’ve been on fire now.
Are we due for a cooling off? Today, there are listings on the fringes that aren’t selling as fast, or at all.
But the red-hot newer tract homes with decent yards and pools will continue to attract a crowd, as will the single-story homes – probably straight through the 2022 selling season.
Most videos of FLW homes are a brief overview, but here the realtor pointed out a number of his details. I don’t know about the price ($8 million), but the house is a classic Wright which should add something:
Trustindex verifies that the original source of the review is Google.
We sold a home with Jim and Donna and from beginning to end they were consummate professionals. Their initial walk through the property resulted in a list of items to be repaired or updated. They supplied a list of vendors and job quotes to do the repairs and updates. We originally wanted to sell ‘as is’ and just get it over with. They gave us a selling price for ‘as is’ and options for doing a few updates/repairs to doing it all with the selling price for each option. We agreed to do all they suggested and we sold for the exact price they predicted. For every dollar spent we got back more than $2 back in the selling price. And they got that price in a rising interest rate environment! Donna and Jim are extremely detailed and guide you through ever aspect of the sale. There were no surprises thanks to their guidance. We couldn’t be more pleased with their representation.
Thank you Donna and Jim,
Jerry and Mary
Heather Quejada
March 27, 2025
Trustindex verifies that the original source of the review is Google.
We have known Jim & Donna Klinge for over a dozen years, having met them in Carlsbad where our children went to the same school. As long time North County residents, it was a no- brainer for us to have the Klinges be our eyes and ears for San Diego real estate in general and North County in particular. As my military career caused our family to move all over the country and overseas to Asia, Europe and the Pacific, we trusted Jim and Donna to help keep our house in Carlsbad rented with reliable and respectful tenants for over 10 years.
Naturally, when the time came to sell our beloved Carlsbad home to pursue a rural lifestyle in retirement out of California, we could think of no better team to represent us than Jim and Donna. They immediately went to work to update our house built in 2004 to current-day standards and trends — in 2 short months they transformed it into a literal modern-day masterpiece. We trusted their judgement implicitly and followed 100% of their recommended changes. When our house finally came on the market, there was a blizzard of serious interest, we had multiple offers by the third day and it sold in just 5 days after a frenzied bidding war for 20% above our asking price! The investment we made in upgrades recommended by Jim and Donna yielded a 4-fold return, in the process setting a new high water mark for a house sold in our community.
In our view, there are no better real estate professionals in all of San Diego than Jim and Donna Klinge. Buying or selling, you must run and beg Jim and Donna Klinge to represent you! Our family will never forget Jim, Donna, and their whole team at Compass — we are forever grateful to them.
Lou F
March 27, 2025
Trustindex verifies that the original source of the review is Google.
WeI had the pleasure of working with Klinge Realty Group to sell our home in Carmel Valley, and I cannot recommend them highly enough!
Jim and Donna demonstrated exceptional professionalism, offering expert guidance on market conditions and pricing strategy, which resulted in a quick and successful sale.
Communication was prompt and we were well-informed throughout the entire process.
For anyone looking for a dedicated and knowledgeable real estate team, look no further!
---
William Sams
March 25, 2025
Trustindex verifies that the original source of the review is Google.
Donna and Jim Klinge of Klinge Realty Group have our highest possible recommendation. From Donna and Jim’s first visit to our house through closing their advice and counsel was candid and honest in all dealings. They kept us fully informed throughout the process. The house sold less than three days after listing with a two-week closing. My wife and I have sold several houses during our lives. This was by far the best experience. Klinge Reality is a premium service realtor. You can’t make a better choice for someone to sell your home fast and for top dollar.
Emily Hernandez
December 29, 2024
Trustindex verifies that the original source of the review is Google.
Donna and Jim provided exceptional support and professionalism throughout the entire process. We couldn't have been happier with their efforts. They made our house shine, and thanks to their expertise, it sold above the listing price in the very first weekend! Truly a fantastic experience from start to finish.
Jesus Adrian Sahagun
November 11, 2024
Trustindex verifies that the original source of the review is Google.
This year has been difficult on our family, mainly due to having to sell our home. Thankfully we knew God had a plan for us and working with the Klinge team was a key part of it. It was an obvious decision to work with them again after such an amazing experience when purchasing the same home we needed to sell. The challenge was, how will we do this in so little time with so much going on? Jim and Donna held our hand every step of the way. Whenever an unexpected issue arose they found and provided a solution. Never once did we feel pressured to make a decision and the Klinges were always reassuring after providing the information that the decision was ours to make. Despite the curve balls, they never panicked and exemplified the “can do” attitude, making us feel optimistic and taken care of. Their expertise and professionalism was superb. But of all the reasons to work with the Klinges, the most impactful and valuable is their compassion and genuine care for their clients. We pray that we can one day purchase our forever home and you better believe that Jim and Donna will be representing us - as long as they will have us of course. Thank you again Klinge team! Your execution, experience, and care are unmatched.
SABIHA PASHA
July 23, 2024
Trustindex verifies that the original source of the review is Google.
Jim and Donna were fantastic! Jim understanding my needs, recommending potential places, pointing out the pros and cons of each property was invaluable. Then when the offer was accepted Donna’s organized guidance through the inspections, paperwork etc made the whole process seem effortless.
So grateful that I had them on my side!
Anu Koberg
July 13, 2024
Trustindex verifies that the original source of the review is Google.
We first found Jim through his blog at bubbleinfo.com, which really showcased his knowledge of SoCal real estate. Since then we've done three transactions with Jim and Donna, and they are an incredible full service agency, with Jim's deep market insight and Donna's deft contract and project management. We trust them implicitly in their analysis and strategy, which is based on years of experience. They're always available and on top of things, and we strongly recommend them to anyone.
Bjorn Isachsen
July 10, 2024
Trustindex verifies that the original source of the review is Google.
The Good
The Klinge Realty Group operates like a finely tuned machine, with a very personal touch. We contacted them on a Sunday and they were talking to us about our family and our needs on our living room couch the following day. They carefully listened to us and worked with us to identify the best and quickest path to listing within 2 weeks to take advantage of the low inventory conditions in our South Carlsbad neighborhood. They knew our tract specifically and had many previous sales there over the years - they came prepared with a thorough analysis of comparative sales and recommended a pricing strategy that they felt confident would yield offers the first weekend on the market.
The Great
Over the next two weeks Donna coordinated a range of vendors who she knew from experience could get the preparation to list work we needed done on time and with high quality. Our light tune-up involved excellent experiences with their stagers, landscapers, contractors, electricians, and plumbers. Throughout this period Donna's daily communication was clear, concise, and responsive. Any time we had questions Donna picked up the phone or texted immediately - but almost always, she answered our questions before we even knew we had them.
The Outstanding
We had a tricky situation with a shared fence that could have delayed our escrow. Donna used superb mediation skills to negotiate the terms of replacement and was personally on site with the fence contractor to make sure everything went smoothly. The fence looks great and escrow closed on time.
The Truly Exceptional
Our house came on the market on a Wednesday and between then and Monday morning Jim was personally at all three open houses. He was in constant communication explaining potential buyer reaction and strength. As he predicted offers began to come in on Saturday and each one was incrementally higher than the last. At the end we had 5 offers, 4 of which were over list, and the final accepted offer was $100,000 over list. In addition to being over list it included rent back terms that met our needs.
The Recommendation
For all of these reasons we would strongly recommend The Klinge Team to anyone wanting to sell in North County Coastal San Diego. I had been reading Jim's bubbleinfo.com blog for 15 years and knew when the time came to sell that he would be our first call. Jim Klinge is not your standard realtor. He is keenly aware of market conditions and sales strategies. And, works his tail off - though not as hard as Donna . At this point he's gone from realtor to friend and I plan to have him over to grill and chill at our new place to talk real estate, but also just about life and raising kids in San Diego. He's more interested in relationships than his sales numbers - and that's why his sales numbers are so high. We have already recommended the Klinge's to some close friends and another successful sale is on deck right around the corner...
Chris Shea
June 21, 2024
Trustindex verifies that the original source of the review is Google.
We recently had the pleasure of working with Jim and Donna from Klinge Realty Group to sell our house, and we couldn't be more satisfied with the experience. From the initial meeting, they listened attentively to our needs and provided invaluable guidance on specific improvements to get our home market ready.
Their responsiveness throughout the entire process was truly impressive. Anytime we had questions or concerns, they were quick to address them, ensuring we felt comfortable and informed every step of the way. What stood out the most was their team and extensive network of tradespeople, which made addressing any necessary repairs or updates seamless and stress-free.
Thanks to their expertise and dedication, our house sold quickly and at a great price. We highly recommend Jim and Donna to anyone looking to buy or sell a home. They are a fantastic team who truly care about their clients and deliver exceptional results.