Newer One-Story Sold for $1,520,000 Cash
We can work the pricing expectations backwards too.
If this is what they are selling for in San Marcos, then anything similar along the coast will be $2,000,000+.

We can work the pricing expectations backwards too.
If this is what they are selling for in San Marcos, then anything similar along the coast will be $2,000,000+.
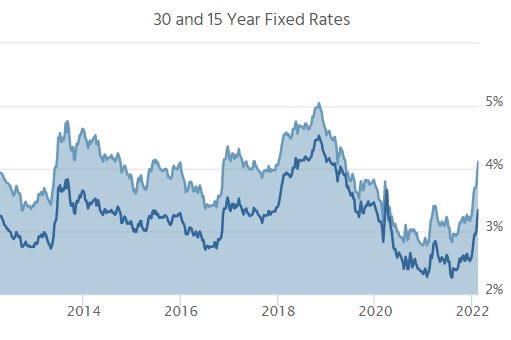
Last Friday was an interesting day for mortgage rates and the broader bond market. Rates began the day roughly in line with Thursday’s latest levels, but bonds lost ground throughout the morning. Multiple lenders adjusted rates higher before 1:30pm. After that, headlines made the rounds regarding the potential Russian invasion of Ukraine, which sent bond yields lower. By the end of the day, many lenders adjusted rates slightly lower.
The new week began with Russian Foreign Minister Lavrov making a series of comments that helped to moderate the more dire tone from Friday. Markets followed in lock step with rates rising to undo a majority of Friday’s improvement. This left the average mortgage lender roughly in line with Friday’s highs. That equates to 30yr fixed rates over 4.0% for most scenarios.
Russia/Ukraine headlines continued throughout the day. Although this did cause some volatility at times, markets progressively tuned out. Moreover, geopolitical risk is not destined to be the key market moving consideration unless things get appreciably worse. Even then, the primary narrative remains focused on inflation and the Fed’s evolving policy response.
Even with the list prices reflecting massively-inflated values, nearly half of the homebuyers felt the need to pay over the list price lately:
NSDCC Detached-Home Sales, % Closed Over List Price
January: 38%
February: 43%
March: 53%
April: 55%
May: 54%
June: 59%
July: 64%
August: 55%
September: 41%
October: 45%
November: 48%
December: 48%
January: 49%
There were another 15% who paid full price in January, so almost two-thirds paid all the money. There were 16 listings that sold with zero days on market too.
~~~~~~~~~~~~~~~~~~~~~~~~~~~~~~~~~~~~~~~~~~~~~~~
Percentage Of Sales Over List Price by Price Range
| Price Range | |||||||||||
| $0 – $1.0M | |||||||||||
| $1.0M – $1.5M | |||||||||||
| $1.5M – $2.0M | |||||||||||
| $2.0M – $3.0M | |||||||||||
| $3M+ |
~~~~~~~~~~~~~~~~~~~~~~~~~~~~~~~~~~~~~~~~~~~~~~~
The January sales were a little soft, historically, but the inventory has been decimated:
NSDCC January Sales
2017: 174
2018: 149
2019: 150
2020: 182
2021: 187
2022: 140
~~~~~~~~~~~~~~~~~~~~~~~~~~~~~~~~~~~~~~~~~~~~~~~
NSDCC Average and Median Prices
| Month | |||||
| Feb | |||||
| March | |||||
| April | |||||
| May | |||||
| June | |||||
| July | |||||
| Aug | |||||
| Sept | |||||
| Oct | |||||
| Nov | |||||
| Dec | |||||
| Jan |
The average sales price went up 7% MoM.
The median sales price went up 4% MoM.
The local pricing flattened out last summer, only to be revived over the last three months.
It should be a crazy spring – probably the craziest ever!
~~~~~~~~~~~~~~~~~~~~~~~~~~~~~~~~~~~~~~
The Super Bowl is complete, and the spring selling season begins today!
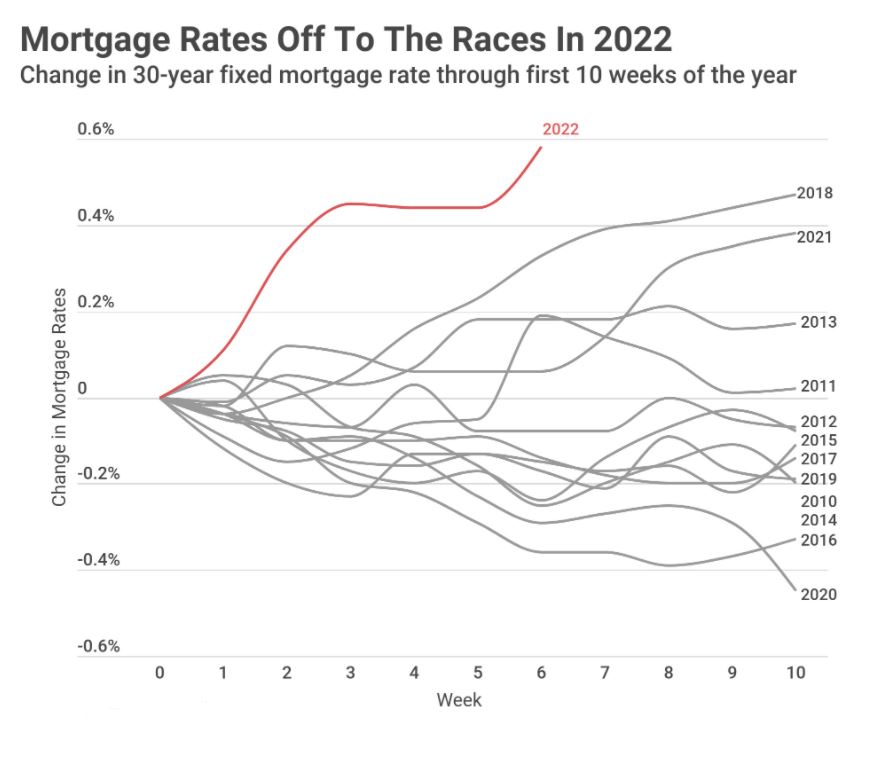
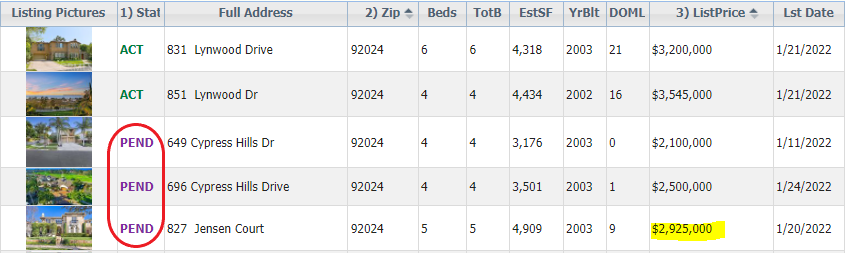
Judging by the quick jump in the total number of pendings, homebuyers aren’t waiting around. Mortgage rates have risen faster than any time in the last dozen years, and the number of homes for sale is scary low:
There was heavy activity over the weekend, and on the hot buys, the offers seemed to be starting at 10% over the list prices – which is now the new normal. Waiving contingencies and giving sellers free rentbacks for 60 days will be part of the landscape for the next few months.
Will rising rates cool off the market? Only for those who are on the fringes and sensitive to payment shock. The affluent – the buyers who are controlling the market – are less impacted, and a measly 1% rise in your loan rate only changes the payment by $1,116 per month on a $2,000,000 mortgage.
How long will the 2022 frenzy last?
It should stay hot until one of the following happens:
By summertime, the pool of highly-motivated buyers should be diminishing, and we’ll be left with those who haven’t been willing to pay these prices. Remember that when you see another crazy-high sales price, there was only one buyer who was willing to pay that much – the rest all wanted to pay less!
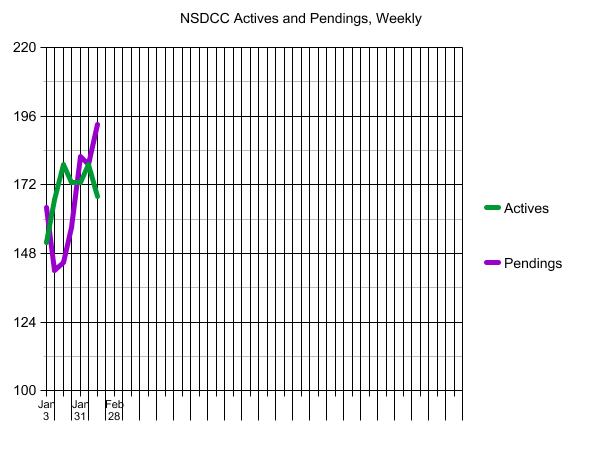
The number of NSDCC active listings has been in a tight range of 167-179 over the last six weeks – which means there is a strong surge of new pendings, evidenced by the purple line racing upward. The number of homes in escrow has grown from 142 on January 10th to 193 today!
As of today, the number of new listings in January is 201, which means it looks like Daniel is going to be the winner, and will receive four tickets to a Padres game…..if there is a season.
The guesses:
142 The other Bob
181 Eddie89
201 Daniel Nicolas
210 Drew
215 Joe
222 Majeed
230 Lifeisradincbad (who was a winner last year)
237 Curtis Kaiser
245 doughboy
250 Deckard Mehdy
259 Susie
260 Derek (the other winner last year and only missed by 1)
270 Skip
278 Haile
286 Matt
290 Esteban del Rio
294 Tom
295 Rob Dawg
300 BWell_SoCal
312 big T
325 Mortgage Guy
373 Rob
The 201 is a 30% drop from the January, 2021 count, and you remember how tight the inventory was last year. Hopefully the pandemic is the cause, and we bounce back to have as many listings as we had last year?
Remember when we thought the dip in 2020 was a temporary covid decline? Yikes!

People say there will always be a need for a realtor, but consumers may adapt to new methods:
JG: How is Zillow addressing these different aspects of the consumer journey?
ES: The problem that we are spending a bunch of time on right now is how do you fix the home-touring problem. We’ve noticed that a lot of times we had a consumer who wanted to go see a home, and couldn’t get in. We went and talked to ShowingTime and they told us that there were 92 million showing requests on our platform last year, but only 68 million of those got fulfilled.
This is a boring problem, and what we are doing is attacking it in three different ways.
The first is a new technology that we call “3D Home” and it’s sort of like your next-generation, virtual tour that allows you to walk through the house. What we found is that homes that have these 3D Home tours are viewed 45% more than homes that don’t have them and on average they sold 14% faster.
Then, we’re putting a bunch of technology, resources and engineering into ShowingTime so that when that buy side request comes in to see a home in person, we can make sure that the agents can connect and we can get that person into the house. We also just launched a beta test of a product where you can actually use the Zillow app as a mobile control to get into the house.
So with these three different projects that we have going on right now, we are going to try to fix this boring but incredibly impactful problem of getting into a house.
JG: What other innovation can we expect that will help drive the next generation of Zillow and its business model?
ES: There are a bunch of things that we are doing to simply help consumers buy homes. We have a really sophisticated artificial intelligence engine that sits behind our user search interface.
We’re doing essentially the same thing for listings that Netflix does when it sends users a “here is a show that you’re probably going to like” suggestion. On the second time you come back to the app or site, we’ve looked at not only what you’ve been searching, but also what people similar to you are searching, and our goal is that on that first page of search results to get you a house we think you’re going to like.
The goal is you should never have to go to page two to get a home that you like.
Another thing is we just launched a feature that we call SharePlay, and what it does is set up a FaceTime call and you and another person can use the app at the same time. In our research we found that 86% of our users on Zillow said they were shopping with someone else—either a spouse, housemate or parent.
https://www.rismedia.com/2022/02/11/zillow-looking-ease-homebuying-journey-post-ibuying/
I was just saying the other day that we’re due for a sale that closes $1,000,000 over the list price……but I’m not going to count this one.
The seller had been telling agents that he wanted $4,000,000, and it went on the Compass internal site at $3,260,000 for a few days before the MLS. Darin sold it and he lives in the ER so he probably knew that the seller’s intentions were to get into the 3’s. The list-it-low strategy worked though!
It does continue a strong run of closed sales in the $3,000,000s over the last year – with my November sale still the all-time leader:
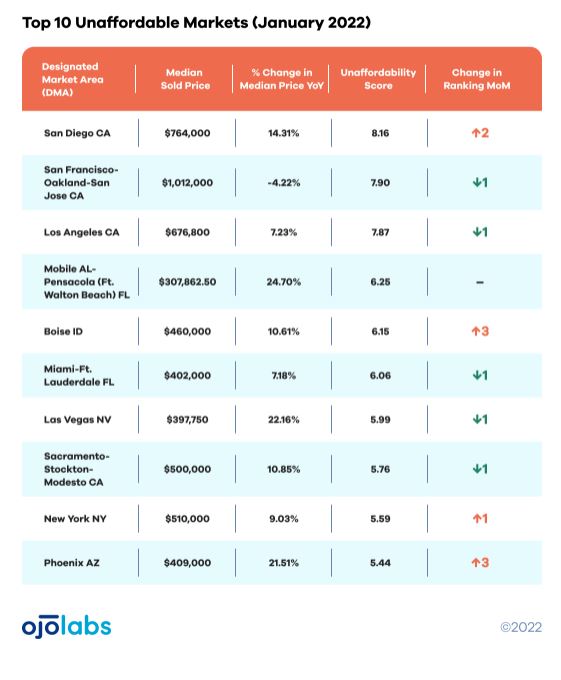
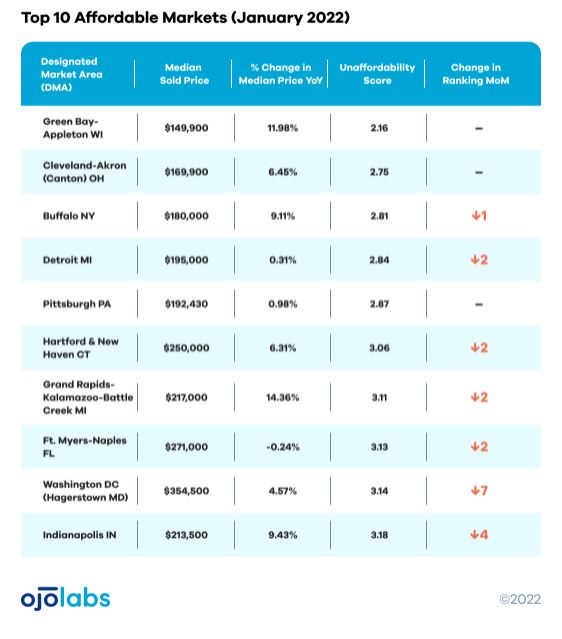
San Francisco is no longer the nation’s least affordable metro area, being surpassed by San Diego, it’s neighborhood to the south. The latest OJO Labs unaffordability report saw San Diego bypass both San Francisco and Los Angeles to become the nation’s least affordable metro by comparing median home price to local incomes.
The median home sold price in San Diego climbed 14.3% in January to $764,000, bringing the city’s unaffordability score — a ratio of home sold price to median household income — to 8.1.
And despite San Francisco still boasting the most expensive housing stock of any metro in the U.S., a 4.2% home sold price decrease in January on an annual basis actually drove San Francisco’s unaffordability score below 8 for the first time since OJO Labs began tracking the data in July 2021. In January, San Francisco’s unaffordability score fell to 7.9, down from 9.2 last month.
Los Angeles; Mobile, Alabama; Pensacola, Florida; and Boise, Idaho metro areas rounded out the top five least affordable metro areas in the U.S.
Unaffordability score is a ratio that’s derived from monthly median housing prices and median household income. The higher the score, the more unaffordable a metro area is for a household making the median income. Median home price data is drawn from local multiple listing service sold data and median household income is derived from 2016-19 census data.
https://email.ojo.com/san-diego-passes-san-francisco-as-nations-least-affordable-metro
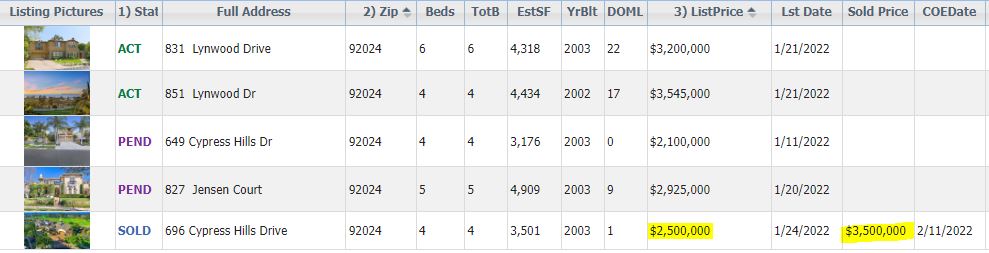
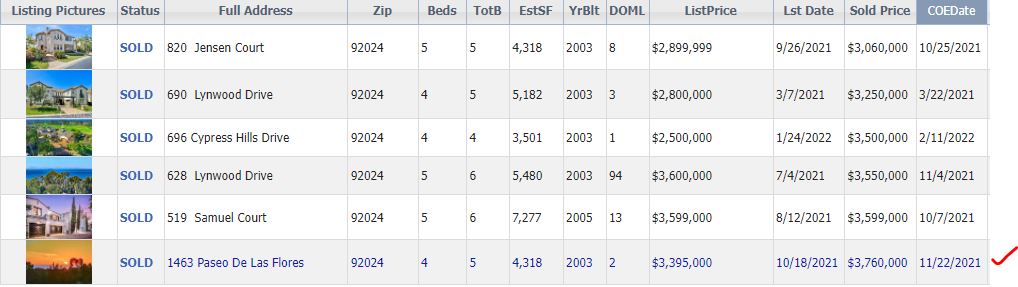
Another follow-up on those five listings that went live on the market in the same week.
A third one (on Jensen Court) went pending this week!
It was the best value of the three homes for sale, so no big surprise.
It’s what we can expect in other areas at other price points though. If there is a surge of listings at the same time, the demand is probably strong enough to pick them all up, or at least cause them to sell in the order of the best value available.
It will be when none of them sell that a red flag is raised.
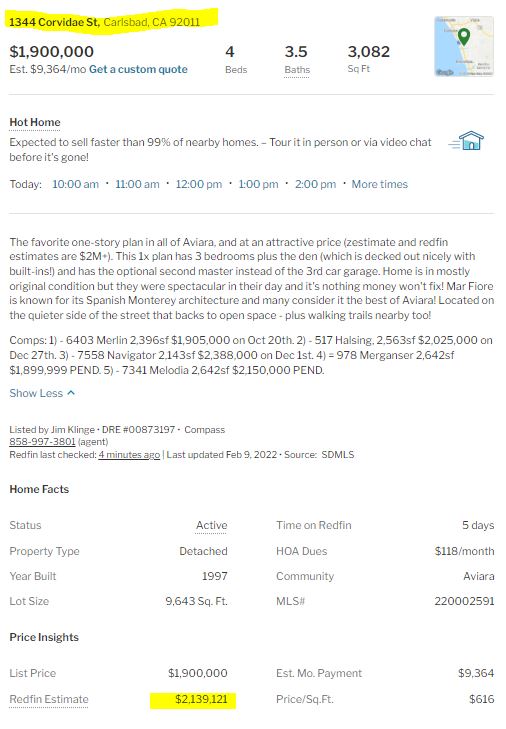
We see on every listing how the estimated values jump all over the place.
On my Aviara listing, the initial estimate was $2,247,615, but once the home hit the open market, the red team lowered their estimate by $313,637 to $1,933,978. A few days later, they have INCREASED it by $205,143 to $2,139,121…….which are some wild swings in less than a week!
It appears that the automated valuations can be wrong by 10% to 20%, and the guys behind the curtain are manipulating them as needed. A scary thought if people are relying on them.
Do people rely on them?
There are probably buyers who are believers, and use them to decide how much to pay for a home.
But it’s even worse for sellers. It’s been happening more and more that home sellers are putting more faith in their zestimate and Redfin estimate. If those estimates are higher than what their agent tells them, of course they want to list for a higher price and they wave around their computerized values as proof.
In today’s frenzy it may not seem to matter much, but there will come a day when accurate valuations will become more necessary.
Or will it?
Rob talks about the changes being made to the GSE’s underwriting guidelines below.
Fannie Mae and Freddie Mac are issuing more appraisal waivers based on automated property valuations! Usually it’s because the down payment is sufficient enough that they aren’t that worried about a default. But once the guidelines are changed, won’t it just be a matter of time before appraisals as we knew them become extinct?