Tom Helps A Vet – Thank You!
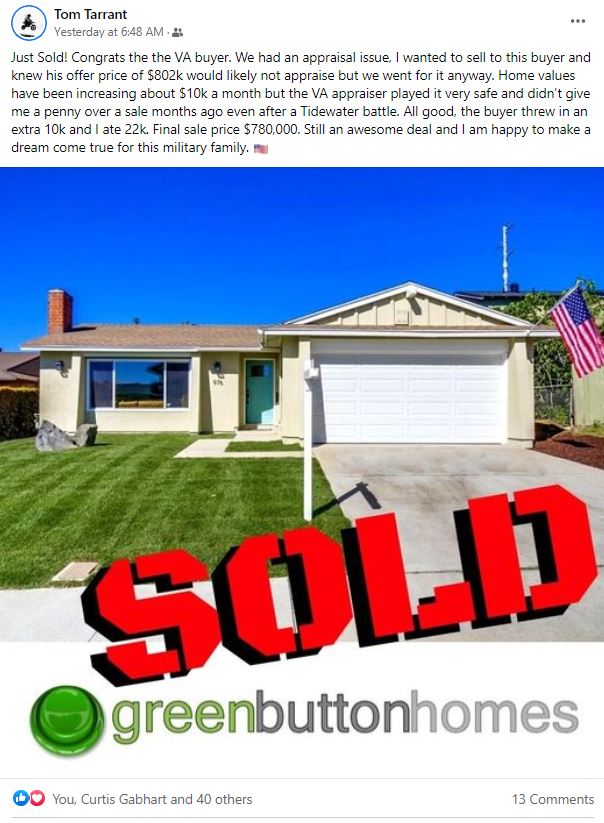
https://www.compass.com/app/listing/976-hawaii-avenue-san-diego-ca-92154/1009401494557694689

https://www.compass.com/app/listing/976-hawaii-avenue-san-diego-ca-92154/1009401494557694689
Everyone’s asking the question – who has the answer?
Our daughter Kayla is upping her video game:
If you, or someone you know, is thinking of moving to New York City – she can help!
There is some some discussion among the talking heads that a moderating frenzy could cause more sellers to come to market in hopes of getting out while they can. They may be right in areas where inventory is already exploding.
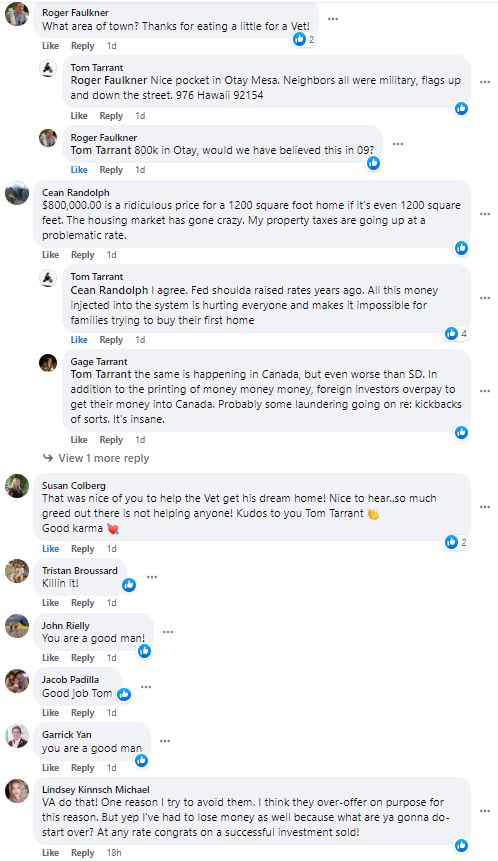
But not in San Diego, where last month the new listings dropped more than anywhere else.
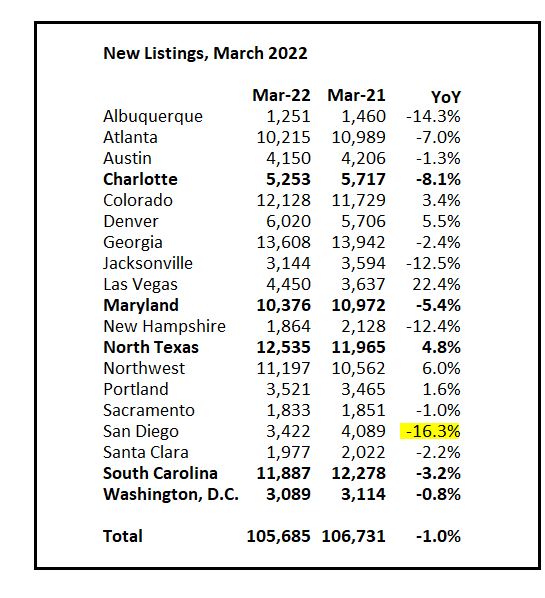
As the selling season opens up, it is normal for the inventory to rise, and below you can see that sexy destinations like Austin, Denver, Nashville, etc. experienced large increases between February and March.
But not in San Diego, where in March the active inventory month-over-month went DOWN!
No surprise that San Diego is the place where people are least-likely to leave!

What a wild ride lately! It’s safe to say we’ll never see a March like this again:
NSDCC March Sales & Pricing
| Year | ||||
| 2015 | ||||
| 2016 | ||||
| 2017 | ||||
| 2018 | ||||
| 2019 | ||||
| 2020 | ||||
| 2021 | ||||
| 2022 |
The median sales price went from $1,445,000 to $2,625,000 in two years – an increase of 82%!
Last month’s median sales price was $200,000 ABOVE the median list price (108%), and it was 10% higher than it was in the previous month.
We are going to have to live with fewer sales from now on.
Like most real estate talk, half of this is horsepucky:
Just because everyone is buying a house, doesn’t mean you should be too, said Donald Olhausen Jr., owner of We Buy Houses in San Diego. “I have seen many people force bad decisions because they have fear of missing out (FOMO). Forcing a bad deal will not rectify itself because there were no other options or because you felt stuck. Being patient in this market is hard, but overpaying for a faulty property will ultimately lead to more regret.”
There is not one universal housing market, but rather “many smaller micro-markets,” said Michael Shapot, Esq., licensed associate real estate broker. “Some of those submarkets are ‘hot, less hot or more hot’ and they may change week by week, or month by month.”
Elisa Uribe, a realtor with Wells and Bennett Realtors added that “real estate is hyper-local,” so consider the source. “You can withstand any market changes if you don’t have to move in a specific time frame.”
Real estate experts like Marina Vaamonde, the founder of PropertyCashin, said that 2022 would be a better time to buy because, “The demand for residential real estate is still vastly overshadowing the inventory.”
Indeed, now that 2022 has arrived, experts still agree that is the case, even with decreasing inventory. According to Time, home prices will not increase as rapidly and home values will also likely increase at a less vigorous rate than the peak of 2021, which bodes well for buyers.
What made 2021 unique was extremely low interest rates, according to David Friedman, CEO of investment property platform Knox Financial. “There have been very few times in history when we’ve seen 30-year fixed mortgage rates hovering around 3.3% and 15-year mortgage rates slightly above 2.6%,” he said.
However, on March 16, 2022, The Federal Reserve raised rates for the first time in years by 0.25%. What this likely means, according to NerdWallet, is that mortgage rates will follow suit by increasing, meaning homebuyers will pay more in interest.
Despite these slight increases in interest rates, and decreases in inventory, this doesn’t necessarily mean the market is going down.
Khari Washington, a broker and owner of 1st United Realty & Mortgage, added, “No one knows if the housing market will drop and when it will drop. Most reports talk about the market slowing in 2023 but not falling. Builders have not built enough housing and interest rates remain low.”
“The right time to buy is when a person is ready,” adds Washington.
Waiting can be a gamble, said Jeff Shipwash, CEO of Shipwash Properties LLC. “You could be waiting to purchase with the thought of prices coming down, but…even if home prices do pull back some, if rates increase it will all be for nothing. You may be able to afford a $300,000 house at current rates. But if those rates increase by 1% while you wait, that same payment may be on a $250,000 house.”
If not buying means renting, consider that “the current rental market is on fire with rents skyrocketing and landlord incentives eliminated,” said Shapot. Renting will not be a cheaper option in the long run.
Unlike the unstable market leading up to the economic crash of 2008, this market is stable, said Jennifer Shannon, a broker associate with Keller Williams Realty. “This market run-up hasn’t been driven by investors, flippers and bad mortgages. It’s been driven by legitimate buyers who are more free to determine where they live than ever.” While demand will start to slow eventually, she says there are no indicators of prices going down anytime soon.
“You’re ready to buy a home when you’re ready, not when there’s a frenzy,” said Tabitha Mazzara, director of operations at mortgage lender MBANC. “The frenzy is a seller’s market, so missing out on a frenzy is a good thing for buyers.”
Chase Michels, owner of Compass, The Michels Group, added, “If a client is fully committed to buying and is in the appropriate financial position to do so, then they should be looking. You may buy at a little lower or higher price at different times of year but that is typically unpredictable in a smaller market.”
Link to Article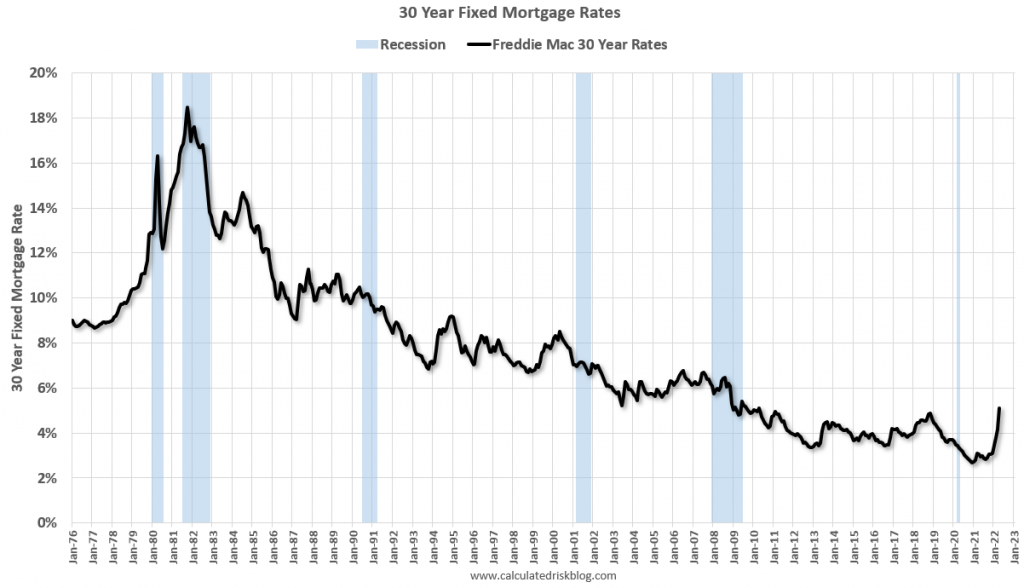
I suggested that mortgage rates should settle into the 4.75% to 5.50% range, and Bill at CR thinks the range will be 5.0% to 5.7%. Today’s rates are in the low 5s, so we have arrived and buyers should not feel the need to hurry up – but it will be bumpy over the next few months. Those with a short runway can opt for 2.375% for ten years.
Currently most forecasts are for the Fed Funds rate to rise to around 3.25%. Goldman Sach’s chief economist Jan Hatzius recently said he thinks the Fed may have to raise rates above 4%, although their baseline forecast is just about 3%.
When the Fed Funds rate peaks in this cycle, the yield curve will likely be fairly flat – meaning the 10-year treasury yield will be at about the same level as the Fed Funds rate. Based on the current estimate for the peak Fed Funds rate (3.25% to 4.0%), the 30-year fixed mortgage will likely peak at between 5.0% and 5.7%. There is some variability in the relationship, so we might see rates as high as the low 6% range. (This all depends on inflation and the Fed Funds rate – but I don’t expect rates to move much higher than the current rate – although 6% is possible).
Of course, rates are still historically low. But rates are up sharply from the recent lows, and my view is the change in rates is what will impact housing (see my post last month: Housing, the Fed, Interest Rates and Inflation; Housing is a key transmission mechanism for the FOMC).
Development proposals have been requested by the City of Carlsbad and the NCTD for the properties adjacent to the train tracks. A brief review:
Click here for more info:
Link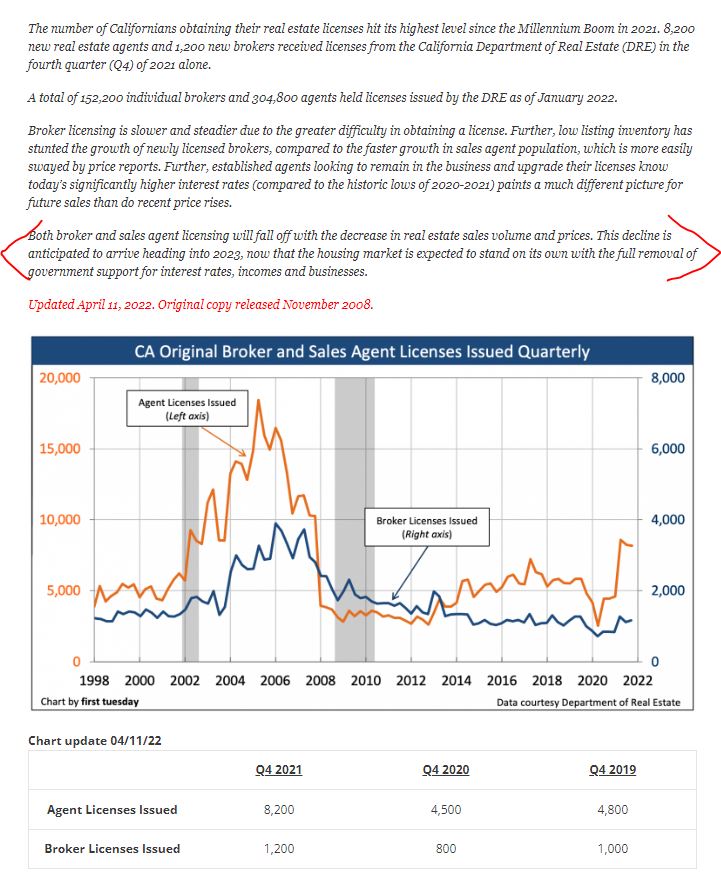
https://journal.firsttuesday.us/sales-and-broker-population-2/61530/
More people continue to get their real estate license.
It looks like there have been around 8,000 new licensees in each of the last 2-3 quarters! There are somewhere between 15,000 and 20,000 dues-paying realtors already in San Diego County, and last month there were 3,198 residential sales on the MLS…..for the whole county!
I think that their doomy author has been misreading the market for years, but if you are thinking about becoming a realtor, believe their nonsense and don’t bother – there is not enough business to go around.
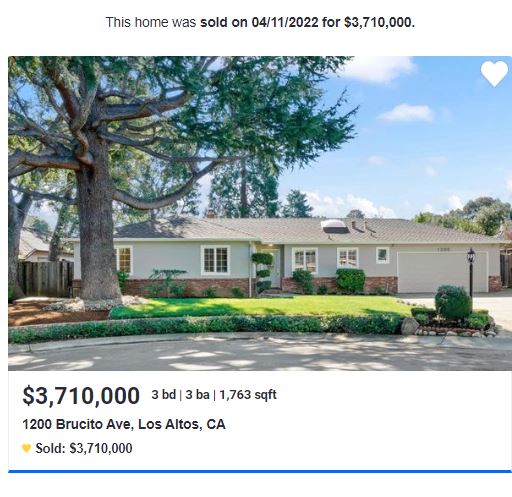
Sally’s former home in Los Altos closed yesterday for what seems to be the obligatory $500,000 over the list price (LP was $3,195,000):
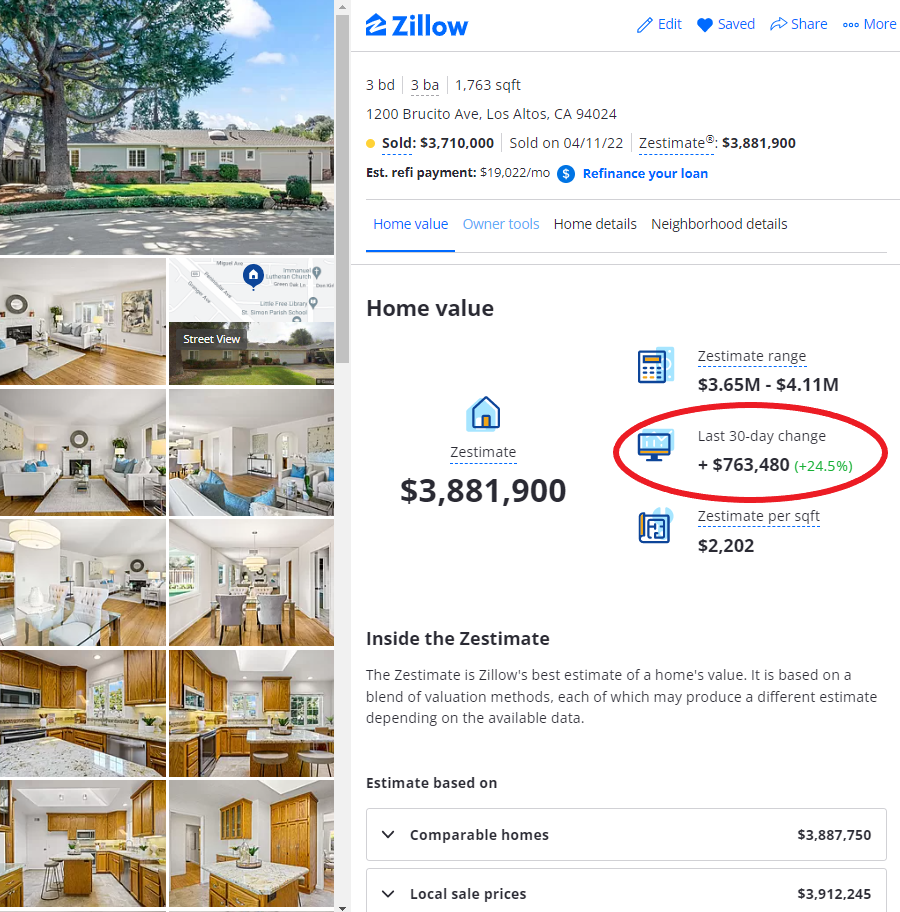
https://www.zillow.com/homedetails/1200-Brucito-Ave-Los-Altos-CA-94024/19620416_zpid/
The bump over the list price is so customary in the local area that the zestimate was raised by $763,480 about the time it was marked pending – the algorithms already had the expected increase baked in!
They are enjoying The 2022 Lucky Windfall of the First Quarter, and we’ll see how well it holds up. But as long as home sales in the Bay Area keep selling for much-higher pricing than in San Diego, one of our main feeder areas will keep sending happy buyers our way!
The list prices mentioned here all say that they sold for 100% of the LP, but it’s a typo – they all sold for well over. For example, Patrick Way sold for $1.1 million over, and William Henry sold for $800,000 over list:
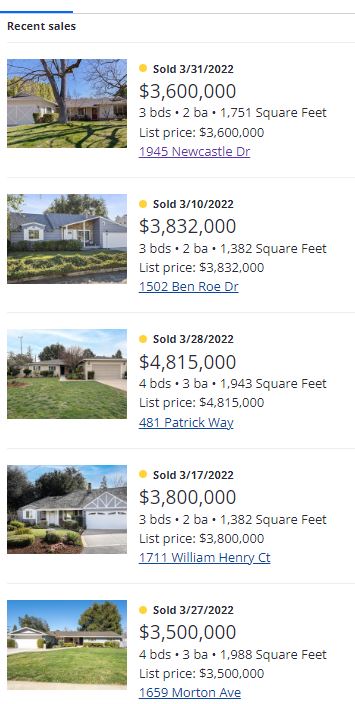
Paying ~$2,000/sf for modest homes in Los Altos has been fairly routine lately!
Hopefully, those sellers keep coming our way. Even if their market were to dip 10% to 20% from these dizzy heights, they will still love what they can buy here for the money.


