21% Over List
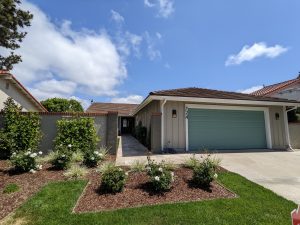
This one had the popular features – remodeled one-story on quiet culdesac with good yard (front and back) plus a big country view over Rancho Santa Fe:

This one had the popular features – remodeled one-story on quiet culdesac with good yard (front and back) plus a big country view over Rancho Santa Fe:
I love a little support from others – thank you Bill!
https://calculatedrisk.substack.com/p/1st-look-at-local-housing-markets-afd
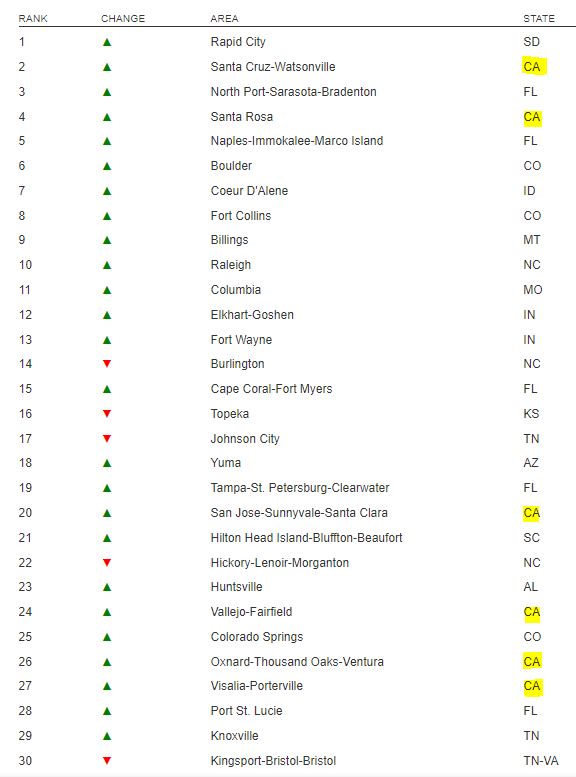
Yuma beat out every town in San Diego County?
Less expensive cities with strong local economies climbed The Wall Street Journal/Realtor.com Emerging Housing Markets Index in the first quarter, another sign that many home buyers are giving priority to affordability.
Fast-rising housing prices have pushed buyers from expensive coastal cities into cheaper housing markets in recent years. Expanded remote-work opportunities and a search for different lifestyles during the Covid-19 pandemic have accelerated the trend.
“People are chasing affordability,” said Sam Khater, chief economist at mortgage-finance giant Freddie Mac. In response to high housing prices and increased remote-work flexibility, he said, “people are reordering where they live.”
The Wall Street Journal/Realtor.com Emerging Housing Markets Index identifies the top metro areas for home buyers seeking an appreciating housing market and lifestyle amenities.
The top-ranked markets in the first quarter had faster home sales, higher wages and shorter commute times than the market as a whole, said George Ratiu, manager of economic research at Realtor.com. News Corp, parent of the Journal, operates Realtor.com.
The Wall Street Journal/Realtor.com Emerging Housing Markets Index ranks the 300 biggest metro areas in the U.S. In addition to housing-market indicators, the index incorporates economic and lifestyle data, including real estate taxes, unemployment, wages, commute time and small-business loans.
We’re close now!
We are still planning to host a Top Gun 2 private screening. I have two different guys attending who were stationed at Miramar NAS when the first film was shot, and their commentary promises to be worth it!
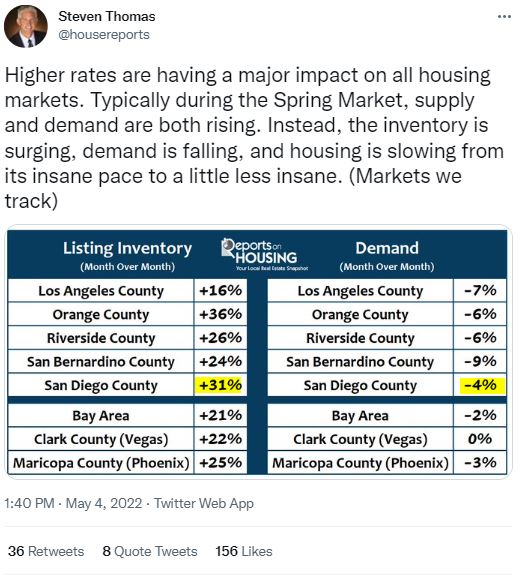
This is an example of the hysteria being whipped up by the pseudo-experts. They tend to grab fake data, jump to conclusions, and then spread it everywhere.
Here is the tweet with comments – he says the +31% is the change between March and April:
https://twitter.com/housereports/status/1521952871490621440
I don’t know where he gets his information, but it isn’t from the MLS:
| Location | ||||||
| SD County | ||||||
| NSDCC Detached |
He says the San Diego Listing Inventory surged +31% between March and April, when it actually dropped on the MLS. Why would he say that? I don’t know, but he sells his data now so that may have something to do with it.
I don’t know how he is measuring ‘demand’, but the San Diego County sales did decline 6% between March and April. But look how close the sales count is to the listing count – we are selling practically everything that comes to market, for pete’s sake. If the listings decline, so will sales.
Is he talking about the active listings?
This is how it looks on InfoSparks. The M-o-M change is +7% (last year was +5%), and the actual count of 2,616 active listings in April is bleak compared to previous years (12,652 in April, 2019!):
None of the facts are suggesting an inventory surge in San Diego County. We would welcome one!
The talking heads are saying that higher rates are slowing sales, and I say it’s the lack of inventory.
If higher rates were the cause, we would see more active listings piling up.
This chart shows how the pendings have dropped off from last year – especially those in yellow:
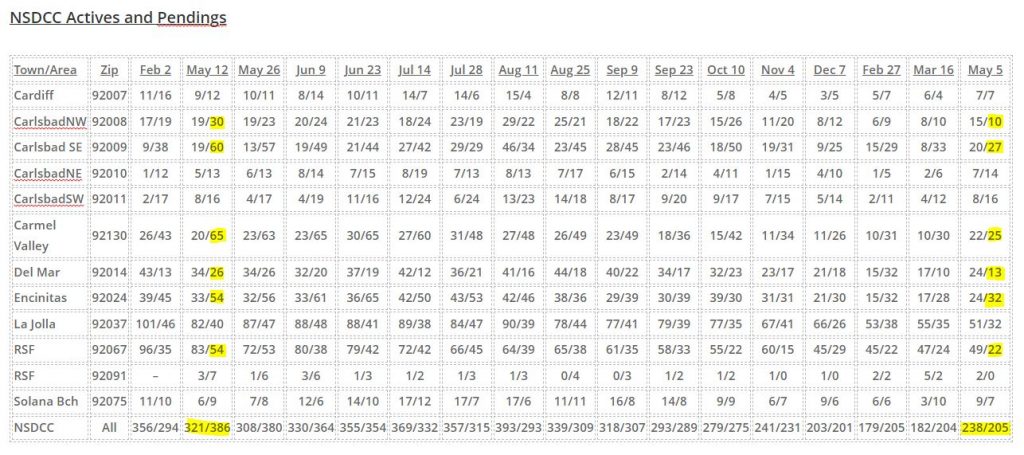
The active-listing counts aren’t any higher – there are just fewer listings overall.
We attended the Adams Avenue Unplugged last weekend in Normal Heights, and it was a great time. We walked down to the A/C Lounge to see Chickenbone Slim & the Biscuits:
and then back to the Normal Heights Methodist Church in time to see John Doe play solo. Tony Hawk is a big fan too – that’s him over the shoulder of the lady in the black-and-white-stripe top:
Hat tip to CB Mark for alerting me to the show!

Last year’s frenzy was crazy because of the volume – there were enough listings to drive sales higher than usual. This year we don’t have as many listings, and it is driving the pricing to astonishing heights:
| Year | ||||
| 2015 | ||||
| 2016 | ||||
| 2017 | ||||
| 2018 | ||||
| 2019 | ||||
| 2020 | ||||
| 2021 | ||||
| 2022 |
The median sales price is 42% higher than it was last April.
If listings dry up further, prices could keep rising!

This house is on a 1.06-acre lot and fixers in this area have been hot, so I guess that’s enough reason to pay over list. I’m sure they will get the last laugh when they build 2-3 houses and sell them for $8 million each.
The big concern for long-time homeowners today is having to pay capital-gains tax on the net profit that’s ABOVE the exempted $500,000 for married couples. While the 2-out-of-5-year rule that was passed in 1997 is due for some adjusting, there haven’t been any indications that the politicians will re-visit the issue.
What can homeowners do to minimize the tax owed?
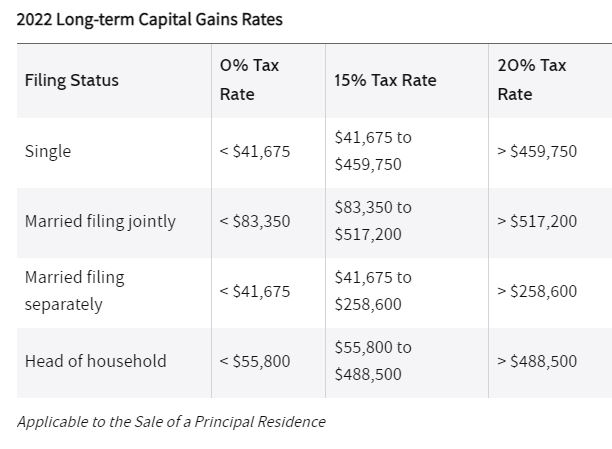
Virtually every long-time homeowner has seen their equity rise enough in the last 12 months to cover their tax exposure, and didn’t that feel like free money? Instead of fretting over having to pay the government, just enjoy the ample amount left over – you made more than they did! Or utilize the tips above.
Check with your tax preparer for more details.


