Buyers have become more reluctant about executing the terms of the contract – and the NBPs are back!
Here is the explanation on how they work:
Q. My buyer was sent an NBP on Wednesday. My question is does the NBP expire 48 hours from delivery/reception, or at 11:59:59 Thursday night?
A. The Notice to Buyer to Perform (“NBP”) provides for a two-day notice to performance (it is not calculated as forty-eight hours – there is a difference). For example, if the NBP was issued on Wednesday, day one is Thursday, and the deadline for performance would be Friday at 11:59pm. The seller may issue a Cancellation of Contract (“CC”) at 12:01am Saturday.
Conversely, if the NBP was issued Thursday, then day one is Friday and day two would end at 11:59pm on Saturday BUT the last day for performance cannot land on a weekend or holiday. In this example, the buyer would have until 11:59pm on Monday (assuming Monday does not land on a legal holiday) to perform (except under the the San Francisco Purchase Agreement).
Remember the NBP can be issued no earlier than two days prior to the Scheduled Performance Day in order for the NBP to be served in accordance with the purchase agreement. If the NBP is served improperly it would have to be sent again thereby extending the timeline for performance.
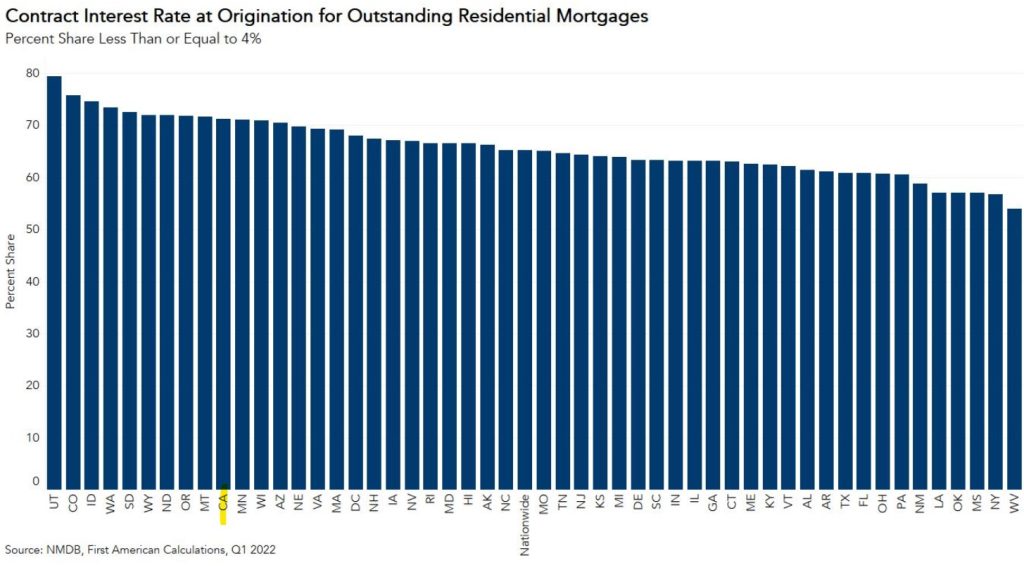
In California, about 70% of the outstanding mortgages have a mortgage rate below 4%, which means it’s unlikely that many of those homeowners will move if they have to qualify for and accept a much-higher rate. Plus, about 30% of local homeowners don’t have a mortgage.
Who is left? Anyone?
Home Buyers Who Will Keep Looking:
Out-of-towners
First timers
1031 exchangers
Parents buying with/for kids.
But with an all-time low inventory of homes for sale expected in 2023, we won’t need the same demand as we’ve had in the past. Let’s look at the annual sales counts.
San Diego County Annual Sales of Detached-Homes
2018: 22,740
2019: 23,124
2020: 23,829
2021: 24,611
2022: 16,086 through three quarters.
The impact from higher rates kicked in during the second half of this year. Up until then, the frenzy carried buyers to the finish line even though they were getting rates in the 4s and 5s. Once rates went over 6% in June, the sales started declining, and it looks like there will be approximately 7,500 sales in second half of 2022. Add to the 10,469 sales from the first half, and the total annual sales will be around 17,969 this year.
Higher rates will probably persist, and the annual sales next year will likely be under 17,000 in San Diego County – an area of 3.3 million people.
The number of listings in 2022 is running about 11% lower than last year, and if there is another 11% decline next year (likely), it will leave us with roughly 22,654 homes for sale in 2023. If only 60% of those actually sell, then sales would be 13,592 for the county, which will be roughly 24% fewer than in 2022, and 45% fewer than in 2021.
The only thing that could change the outcome is if we have the Big Capitulation, where both sellers and buyers give enough to make more sales happen.
Next year, everyone will be talking about how mortgage rates in the 7s or 8s will be causing a lack of affordability, but I have bad news for those who still want to buy.
There probably won’t be many homes for sale.
It will only take one or two headlines about the real estate market being crushed by high rates to cause potential sellers to pack it in until “the market gets better”.
Look how few sellers came to market last month:
NSDCC Detached-Home Listings, October
Year
Number of Listings
Median List Price
2018
401
$1,555,000
2019
371
$1,695,000
2020
400
$1,849,350
2021
228
$2,160,000
2022
174
$2,362,500
Before last year, the lowest October-listings count over the last twenty years was 312 in 2012, and back in the golden years of real estate, there were 452 October listings in 2001, and 510 in 2002!
510 vs. 174?
Yikes!
Hopefully, those who do list their homes for sale next year will be highly motivated, and, lucky for them, having so few competitors will cause their list prices to stay elevated.
Don’t be surprised if the 2023 spring selling season ends up being the Greatest Standoff Ever!
I’ve been hoping for 100+ sales per month the rest of the way this year.
Currently, the October count is 108, so it should get up to around 120 sales by mid-November. Here are the monthly sales and pricing for 2022:
NSDCC Detached-Home Monthly Sales & Pricing, 2022
Jan
140
$2,828,988
$2,855,213
$2,234,944
$2,240,000
Feb
158
$3,063,331
$3,108,907
$2,149,500
$2,386,500
Mar
207
$3,247,251
$3,337,348
$2,400,000
$2,625,000
Apr
227
$3,190,161
$3,251,604
$2,350,000
$2,550,000
May
214
$2,941,080
$3,030,794
$2,350,000
$2,480,000
Jun
188
$2,871,956
$2,881,314
$2,297,500
$2,350,000
Jul
152
$2,892,729
$2,833,588
$2,272,000
$2,280,000
Aug
161
$2,953,967
$2,849,332
$2,200,000
$2,150,000
Sep
134
$2,652,892
$2,560,764
$2,134,500
$2,020,000
Oct
108
$3,168,167
$3,042,502
$2,250,000
$2,150,000
I noted last week that the September average and median sales prices were both 23% lower than they were in March. It looks like the final October data could end up being higher.
The average and median sales prices are easily affected by the types of homes that are selling. The recent environment has had smaller, less-expensive homes selling, while the higher-end market has been languishing.
Let’s include more statistics to fill out the picture:
Month
Sales
Average SP
Avg $$/sf
Avg SF
Median SP
Med $$/sf
Med SF
Mar
207
$3,337,349
$1,028/sf
3,498sf
$2,625,000
$853/sf
2,800sf
Sep
134
$2,560,764
$911/sf
2,887sf
$2,020,000
$790/sf
2,598sf
Oct
108
$3,042,503
$931/sf
3,387sf
$2,150,000
$782/sf
2,840sf
While the October average and median sales prices make it look like we’ve turned the corner, once you analyze the house sizes and $$/sf, you’ll see that buyers are still getting more for their money today.
Unfortunately, none of the talking heads in the media will look any further than the median sales price.
Once their house-hunting vacation concludes in February, all potential home buyers will do is decide if the change in the median sales price supports their mindset about purchasing.
Last week, the NAR reported that their Pending Home Sales Index for the west was down 11.7% month-over-month, but we are beating the odds. Today there are 144 NSDCC pendings, which is the same number as there were in the first week of September!
It’s likely that the local market will mellow down easy now that we’re into the holidays. Whichever way the data goes, it will be easy to write it off to year-end malaise.
Our good friends Gary and Cindy sold their house in Carlsbad and moved to Scottsdale in 2020. The house they bought in Estancia at Troon North was a super-custom 6,580sf ‘elegant-rustic’ that was painstakingly-built over five years. Somehow, the visionary original owner wasn’t that good with finances and he got foreclosed. Our friends bought it for $1,759,000 from the bank on April 9, 2020 – just as covid was getting started.
Sensing an opportunity, they put the home on the market in July of this year for $4,725,000. They got a lowball offer right out of the gate for $3,000,000. But after plenty of showings, a spry 81-year old man paid $4,150,000, plus another $125,000 for the furniture, in the first month on the market. It closed on August 25th.
The biggest fear for the North San Diego County coastal region is a meltdown in Bay Area prices.
It’s been estimated that 50% or more of the buyers who were bidding up homes here during the frenzy are from the Bay Area, and Silicon Valley in particular. If prices were to drop 23% to 30% there, it would impact how much they would be willing to spend on replacement homes here.
This is only one example but we can say that this sold at the peak of the market, or close.
This was my uncle’s girlfriend’s house, and when I was there in November to pay my last respects, I told them that my guess at the current value was high-$2,000,000s.
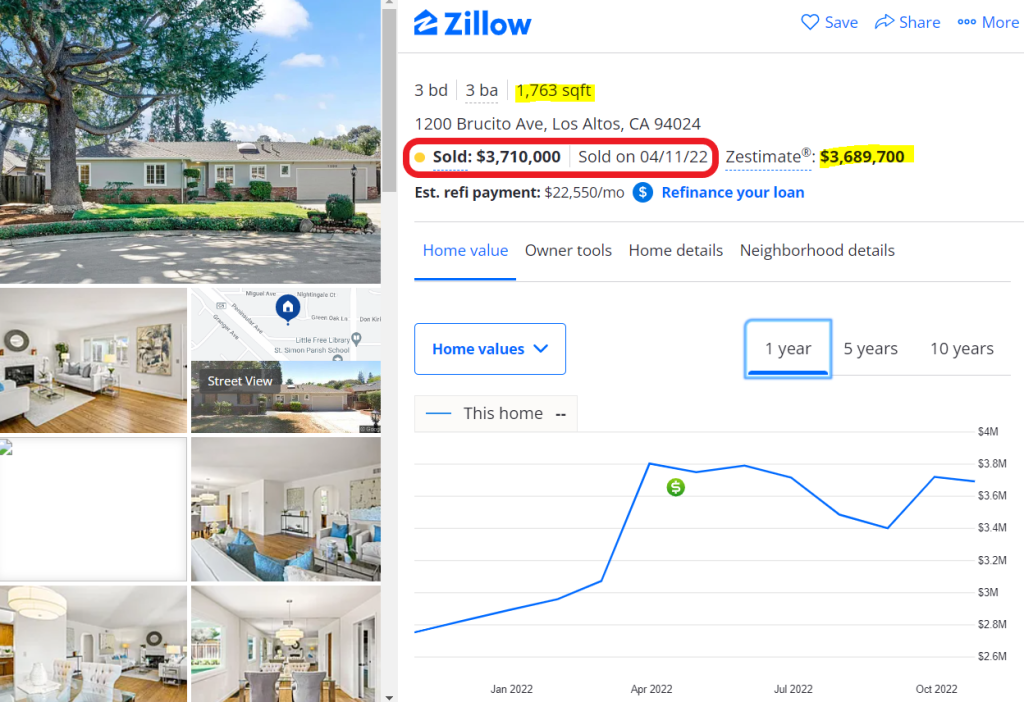
They hired a good agent who spruced it up and staged it, and they listed for $3,195,000 on March 2nd.
A month later, it closed for $3,710,000 for 1,763sf.
How does it look today?
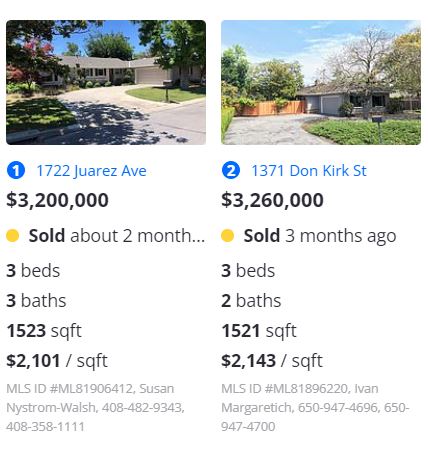
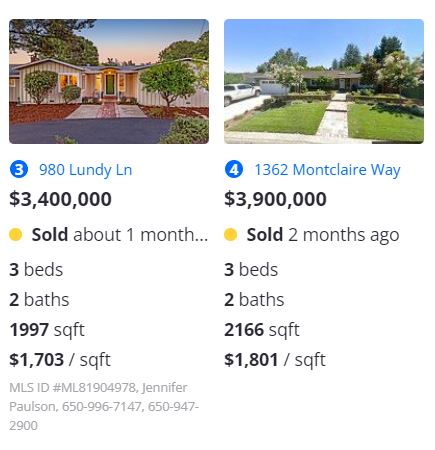
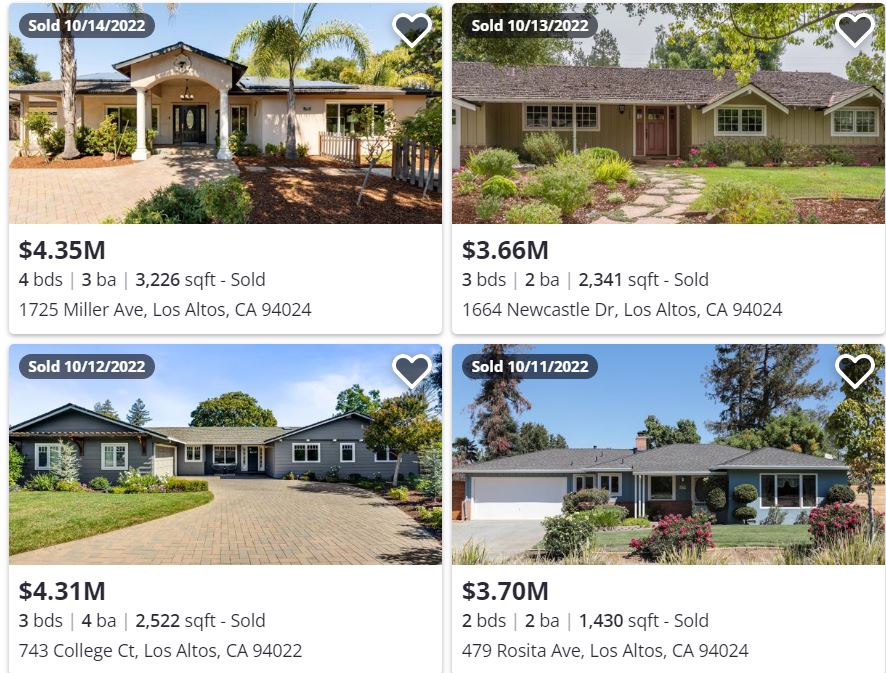
Today’s zestimate is within 1% of the sales price in April, which had been bid up $515,000 over the list price at the time. What are the comps that Zillow says they used to determine the value?
Four recent closings:
It is only one example, and certainly, not everyone from Los Altos is moving here. But just looking at those four recent sales, it seems like that area is holding up pretty good.
Trustindex verifies that the original source of the review is Google.
A+ thank you
Lisa Tuomi
June 11, 2025
Trustindex verifies that the original source of the review is Google.
Many years ago, we purchased a home in Carlsbad, using a realtor that was recommended to us - Jim Klinge. Fast forward to 2025, we recently had the privilege of selling 2 homes in Carlsbad, CA and didn't hesitate to reach out to Jim and Donna Klinge of Klinge Realty Group to guide us through the sales. The transactions were very different, each with its own unique situation, opportunities and challenges. From start to finish, Donna and Jim helped navigate the pre-sale preparation, the listing, showing of the house, buyer negotiations, the final close and all of the paperwork and decisions in between. What stands out with both transactions is the professionalism of Jim and Donna (and their team), wonderful communication (timely, relevant, concise), their deep understanding of market dynamics (setting realistic expectations), their access to top-notch contractors, and last, their ability to guide us across the finish line successfully. We wouldn't hesitate to use Jim and Donna in the future and highly recommend them for anyone looking to buy or sell a property in North San Diego County.
Jerry Meyer
March 28, 2025
Trustindex verifies that the original source of the review is Google.
We sold a home with Jim and Donna and from beginning to end they were consummate professionals. Their initial walk through the property resulted in a list of items to be repaired or updated. They supplied a list of vendors and job quotes to do the repairs and updates. We originally wanted to sell ‘as is’ and just get it over with. They gave us a selling price for ‘as is’ and options for doing a few updates/repairs to doing it all with the selling price for each option. We agreed to do all they suggested and we sold for the exact price they predicted. For every dollar spent we got back more than $2 back in the selling price. And they got that price in a rising interest rate environment! Donna and Jim are extremely detailed and guide you through ever aspect of the sale. There were no surprises thanks to their guidance. We couldn’t be more pleased with their representation.
Thank you Donna and Jim,
Jerry and Mary
Heather Quejada
March 27, 2025
Trustindex verifies that the original source of the review is Google.
We have known Jim & Donna Klinge for over a dozen years, having met them in Carlsbad where our children went to the same school. As long time North County residents, it was a no- brainer for us to have the Klinges be our eyes and ears for San Diego real estate in general and North County in particular. As my military career caused our family to move all over the country and overseas to Asia, Europe and the Pacific, we trusted Jim and Donna to help keep our house in Carlsbad rented with reliable and respectful tenants for over 10 years.
Naturally, when the time came to sell our beloved Carlsbad home to pursue a rural lifestyle in retirement out of California, we could think of no better team to represent us than Jim and Donna. They immediately went to work to update our house built in 2004 to current-day standards and trends — in 2 short months they transformed it into a literal modern-day masterpiece. We trusted their judgement implicitly and followed 100% of their recommended changes. When our house finally came on the market, there was a blizzard of serious interest, we had multiple offers by the third day and it sold in just 5 days after a frenzied bidding war for 20% above our asking price! The investment we made in upgrades recommended by Jim and Donna yielded a 4-fold return, in the process setting a new high water mark for a house sold in our community.
In our view, there are no better real estate professionals in all of San Diego than Jim and Donna Klinge. Buying or selling, you must run and beg Jim and Donna Klinge to represent you! Our family will never forget Jim, Donna, and their whole team at Compass — we are forever grateful to them.
Lou F
March 27, 2025
Trustindex verifies that the original source of the review is Google.
WeI had the pleasure of working with Klinge Realty Group to sell our home in Carmel Valley, and I cannot recommend them highly enough!
Jim and Donna demonstrated exceptional professionalism, offering expert guidance on market conditions and pricing strategy, which resulted in a quick and successful sale.
Communication was prompt and we were well-informed throughout the entire process.
For anyone looking for a dedicated and knowledgeable real estate team, look no further!
---
William Sams
March 25, 2025
Trustindex verifies that the original source of the review is Google.
Donna and Jim Klinge of Klinge Realty Group have our highest possible recommendation. From Donna and Jim’s first visit to our house through closing their advice and counsel was candid and honest in all dealings. They kept us fully informed throughout the process. The house sold less than three days after listing with a two-week closing. My wife and I have sold several houses during our lives. This was by far the best experience. Klinge Reality is a premium service realtor. You can’t make a better choice for someone to sell your home fast and for top dollar.
Emily Hernandez
December 29, 2024
Trustindex verifies that the original source of the review is Google.
Donna and Jim provided exceptional support and professionalism throughout the entire process. We couldn't have been happier with their efforts. They made our house shine, and thanks to their expertise, it sold above the listing price in the very first weekend! Truly a fantastic experience from start to finish.
Jesus Adrian Sahagun
November 11, 2024
Trustindex verifies that the original source of the review is Google.
This year has been difficult on our family, mainly due to having to sell our home. Thankfully we knew God had a plan for us and working with the Klinge team was a key part of it. It was an obvious decision to work with them again after such an amazing experience when purchasing the same home we needed to sell. The challenge was, how will we do this in so little time with so much going on? Jim and Donna held our hand every step of the way. Whenever an unexpected issue arose they found and provided a solution. Never once did we feel pressured to make a decision and the Klinges were always reassuring after providing the information that the decision was ours to make. Despite the curve balls, they never panicked and exemplified the “can do” attitude, making us feel optimistic and taken care of. Their expertise and professionalism was superb. But of all the reasons to work with the Klinges, the most impactful and valuable is their compassion and genuine care for their clients. We pray that we can one day purchase our forever home and you better believe that Jim and Donna will be representing us - as long as they will have us of course. Thank you again Klinge team! Your execution, experience, and care are unmatched.
SABIHA PASHA
July 23, 2024
Trustindex verifies that the original source of the review is Google.
Jim and Donna were fantastic! Jim understanding my needs, recommending potential places, pointing out the pros and cons of each property was invaluable. Then when the offer was accepted Donna’s organized guidance through the inspections, paperwork etc made the whole process seem effortless.
So grateful that I had them on my side!
Anu Koberg
July 13, 2024
Trustindex verifies that the original source of the review is Google.
We first found Jim through his blog at bubbleinfo.com, which really showcased his knowledge of SoCal real estate. Since then we've done three transactions with Jim and Donna, and they are an incredible full service agency, with Jim's deep market insight and Donna's deft contract and project management. We trust them implicitly in their analysis and strategy, which is based on years of experience. They're always available and on top of things, and we strongly recommend them to anyone.