Buyers Were On Vacation
I don’t know how they get this information, but it helps to confirm what it felt like in the second half of 2022 – buyers weren’t interested. It looks like they are starting to come around now though:

I don’t know how they get this information, but it helps to confirm what it felt like in the second half of 2022 – buyers weren’t interested. It looks like they are starting to come around now though:
I share a birthday with this guy:
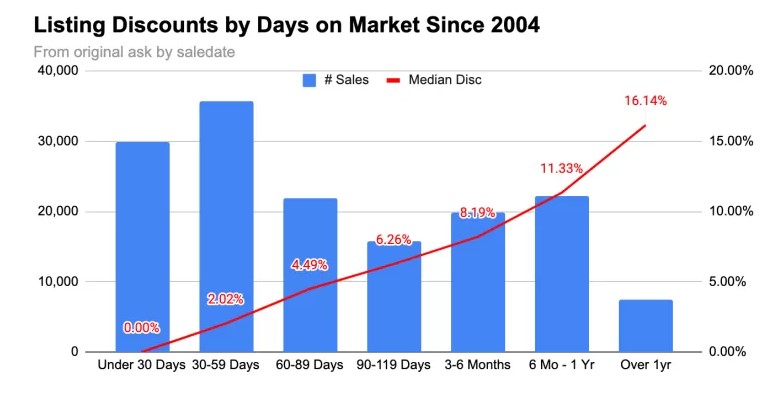
This is from NYC but it still applies – and validates how buyers everywhere are watching the Days-On-Market very closely, and expecting discounts the longer a listing sits unsold.
An excerpt:
His findings (above) show discounts steadily rising around 2 to 2.5 percent per 30 days on the market until around six months on the market. Then there appears to be an acceleration and discounts rise by 3.5 percent and then nearly 5 percent per 30 days.
Read full article hereI asked them to write a blog post for bubbleinfo.com. I think my job here is secure……
In recent years, the real estate market has been experiencing a phenomenon known as a “bubble.” But what exactly is a real estate bubble, and why is it causing such a stir in the industry?
A real estate bubble occurs when the price of properties in a particular market rise significantly and then drop just as dramatically, often due to market speculation and overheated demand. This results in a situation where property prices are not supported by economic fundamentals such as income and employment growth.
Bubbles can have serious consequences for both the real estate market and the wider economy. When the bubble bursts, it can lead to a sharp decline in property values, causing homeowners to owe more on their mortgage than their home is worth. This can result in widespread foreclosures, a drop in consumer spending, and a slowdown in economic growth.
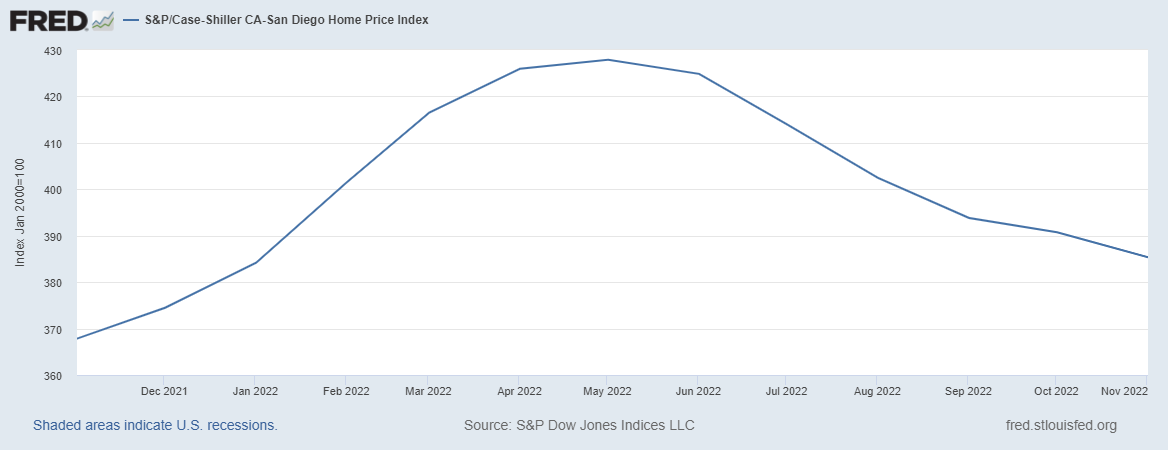
Today’s local Case-Shiller reading for November is the fifth in a row that reflects the much-higher mortgage rates. The index has dropped 9% since May – don’t be surprised if in the future we see a similar trend of enthusiasm in springtime, and doldrums in the off-season:
San Diego Non-Seasonally-Adjusted CSI changes
| Observation Month | |||
| Jan ’21 | |||
| Feb | |||
| Mar | |||
| Apr | |||
| May | |||
| Jun | |||
| Jul | |||
| Aug | |||
| Sep | |||
| Oct | |||
| Nov | |||
| Dec | |||
| Jan ’22 | |||
| Feb | |||
| Mar | |||
| Apr | |||
| May | |||
| Jun | |||
| Jul | |||
| Aug | |||
| Sep | |||
| Oct | |||
| Nov |
If the index keeps dropping over the next few months (likely), it should mean that it will get down to the late-2021 numbers. Will that be enough to impress buyers that prices are reasonable now? Or will they just go out and buy because it’s springtime?

At the end of this video, I describe how I conduct my bidding wars – it’s so simple, everyone should do it!
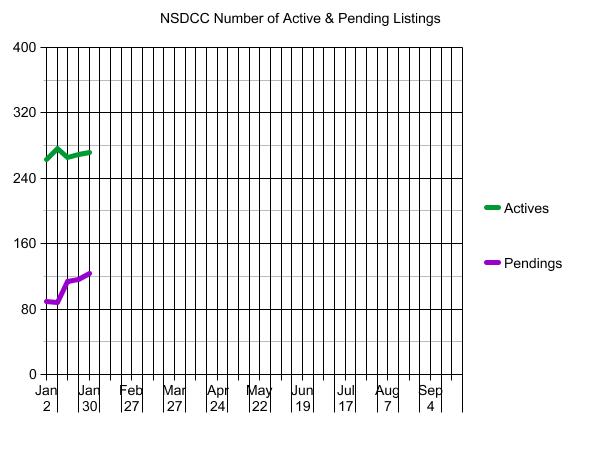
Thirty days into the new year and I have no concerns about the market – other than the nagging low inventory. As recently as 2019, we had 419 listings in January, and this month we won’t get half that many!
Things are improving on schedule – the actives’ count is growing (needed), and the pendings are up 38%:
NSDCC Active & Pending Listings on Jan 2 and on Jan 30
| Price Range | ||
| 0 – $1.5M | ||
| $1.5M – $2.0M | ||
| $2.0M – $3.0M | ||
| $3.0M – $4.0M | ||
| $4.0M+ | ||
| Totals |
For our contest participants, there have been 159 new listings this month. It means our contest should wind up around 180-190 listings, which is a little higher than expected (the median guess was 160).
~~~~~~~~~~~~~~~~~~~~~~~~~~~~~~~~~~~~~~~~

If you are reading this on a mobile device, these features will be at the bottom of your screen.

Last week, we lost a big agent to a start-up brokerage, and I hate to see people go. I’m not sure what happened in their case, but typically agents don’t try to re-negotiate with their current brokerage, instead they just leave for the greener grass without notice.
What should be considered is how likely it will be that single agency and off-market sales will grow as the market constricts further. The count today is probably under 10% of the total sales, but once it catches fire, those non-traditional sales could rise to 20% or 30% quickly.
Don’t underestimate how desperate it could get for agents, and how management will play a key role in pushing for in-house sales. It will be the same as with commercial real estate; where properties get sold in-house and public exposure to new listings is an afterthought.
This threat is the main reason why I work at Compass (of many). It’s not here yet, but it’s coming – and every agent will want to be with #1 as this evolves. We want to hire more agents on our team. If you would consider joining us, contact Donna the sales manager!
View this post on Instagram
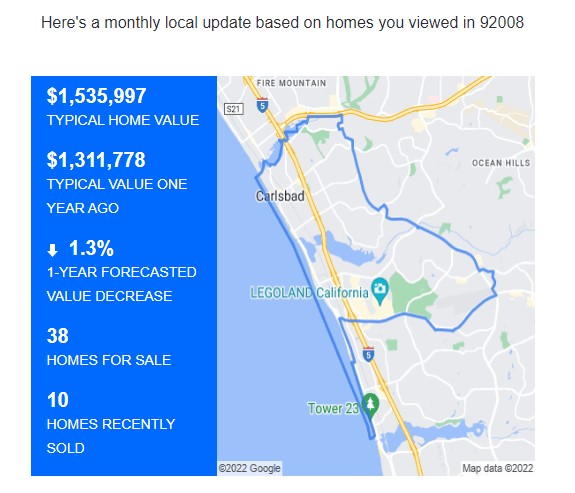
It looks like Zillow is sticking with their relatively flat forecasts for our local areas. It’s probably realistic if appreciation goes like it did in 2022 – everything gained in the spring selling season is given back in the off-season. Note how the ‘typical home value’ is still higher than it was a year ago in every area:
Since June, I’ve been saying “Wait until springtime”.
Here is what’s coming:


