
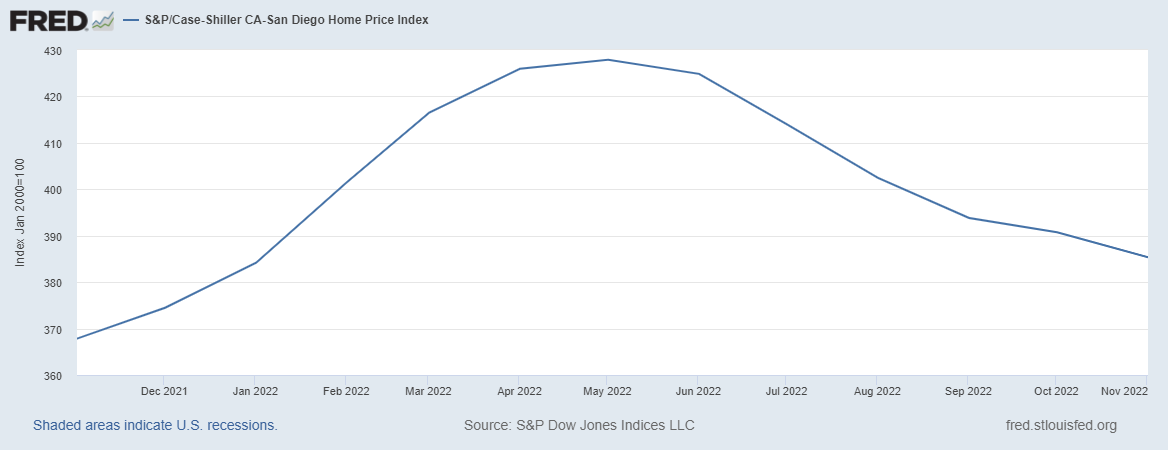
Today’s local Case-Shiller reading for November is the fifth in a row that reflects the much-higher mortgage rates. The index has dropped 9% since May – don’t be surprised if in the future we see a similar trend of enthusiasm in springtime, and doldrums in the off-season:
San Diego Non-Seasonally-Adjusted CSI changes
| Observation Month | |||
| Jan ’21 | |||
| Feb | |||
| Mar | |||
| Apr | |||
| May | |||
| Jun | |||
| Jul | |||
| Aug | |||
| Sep | |||
| Oct | |||
| Nov | |||
| Dec | |||
| Jan ’22 | |||
| Feb | |||
| Mar | |||
| Apr | |||
| May | |||
| Jun | |||
| Jul | |||
| Aug | |||
| Sep | |||
| Oct | |||
| Nov |
If the index keeps dropping over the next few months (likely), it should mean that it will get down to the late-2021 numbers. Will that be enough to impress buyers that prices are reasonable now? Or will they just go out and buy because it’s springtime?


