
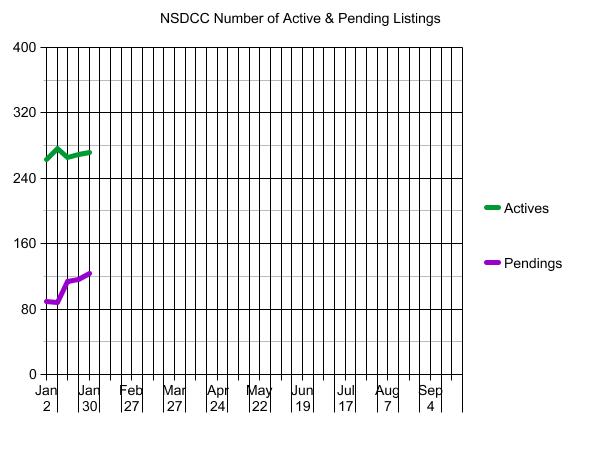
Thirty days into the new year and I have no concerns about the market – other than the nagging low inventory. As recently as 2019, we had 419 listings in January, and this month we won’t get half that many!
Things are improving on schedule – the actives’ count is growing (needed), and the pendings are up 38%:
NSDCC Active & Pending Listings on Jan 2 and on Jan 30
| Price Range | ||
| 0 – $1.5M | ||
| $1.5M – $2.0M | ||
| $2.0M – $3.0M | ||
| $3.0M – $4.0M | ||
| $4.0M+ | ||
| Totals |
For our contest participants, there have been 159 new listings this month. It means our contest should wind up around 180-190 listings, which is a little higher than expected (the median guess was 160).
~~~~~~~~~~~~~~~~~~~~~~~~~~~~~~~~~~~~~~~~

NEW FEATURES AT BUBBLEINFO.COM – RIGHT-HAND COLUMN>>>
- In the right-hand column, you can subscribe to bubbleinfo.com and the new blog posts will be sent to your email automatically. I think it’s been broken for a while, so if you have subscribed previously, try again on this app and it will alert you if your email is already on file.
- Clicking on the image will take you to my collection of the best one-story homes on the MLS!
If you are reading this on a mobile device, these features will be at the bottom of your screen.
The $0 – $1,500,000 Market:
| Date | ||||
| Jan 2, 2023 | ||||
| Jan 9 | ||||
| Jan 16 | ||||
| Jan 23 | ||||
| Jan 30 |
The $1,500,000 – $2,000,000 Market:
| Date | ||||
| Jan 2, 2023 | ||||
| Jan 9 | ||||
| Jan 16 | ||||
| Jan 23 | ||||
| Jan 30 |
The $2,000,000 – $3,000,000 Market:
| Date | ||||
| Jan 2, 2023 | ||||
| Jan 9 | ||||
| Jan 16 | ||||
| Jan 23 | ||||
| Jan 30 |
The $3,000,000 – $4,000,000 Market:
| Date | ||||
| Jan 2, 2023 | ||||
| Jan 9 | ||||
| Jan 16 | ||||
| Jan 23 | ||||
| Jan 30 |
The $4,000,000+ Market:
| Date | ||||
| Jan 2, 2023 | ||||
| Jan 9 | ||||
| Jan 16 | ||||
| Jan 23 | ||||
| Jan 30 |
NSDCC Weekly New Listings and New Pendings
| Week | ||||
| Jan 2, 2023 | ||||
| Jan 9 | ||||
| Jan 16 | ||||
| Jan 23 | ||||
| Jan 30 |
NSDCC Weekly LP Quartiles
| Week | |||
| Jan 2, 2023 | |||
| Jan 9 | |||
| Jan 16 | |||
| Jan 30 |
For previous years, click here:


https://sacramentoappraisalblog.com/2023/01/30/the-housing-market-went-from-an-ice-bath-to-a-hot-shower/