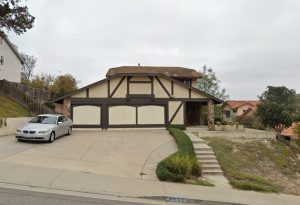
This is the house that received THIRTY offers last month.
My thoughts:
The supply of houses priced under $700,000 is scarce, with overwhelming demand.
This is all you’re going to get from now on, and it won’t get better. I feel sorry for the kids.
My buyers offered $700,000 with 20% down and didn’t get a counter.
The listing agent didn’t round-trip it and the winner paid $730,000 and financed the purchase. How do you know if others would have made a better offer if you don’t include them?
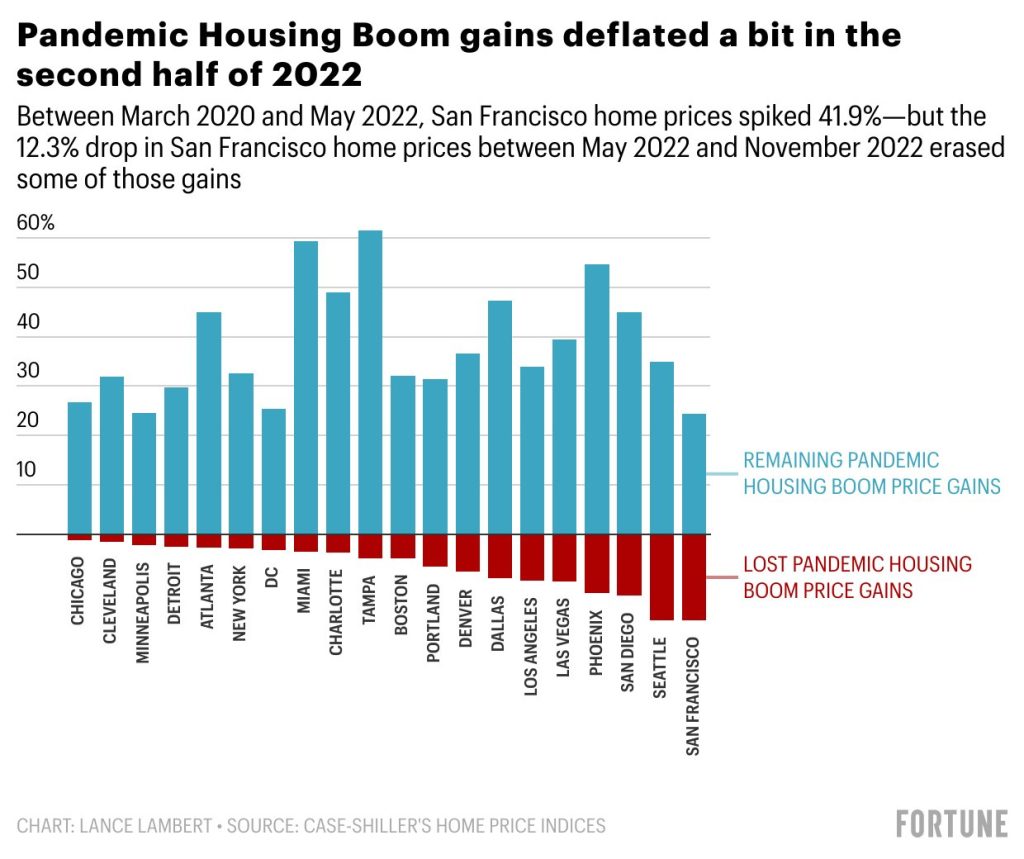
When mortgage rates started going up last year, I said all we have to do is survive until springtime – and it looks like we’ve made it!
Not only did our local market not crash and burn, it held up pretty well – and that’s in spite of the higher rates and blistering doomer attack over the last eight months.
The San Diego Case-Shiller NSA stats:
Mar 2020: 268.19
May 2022: 421.29 (+57%)
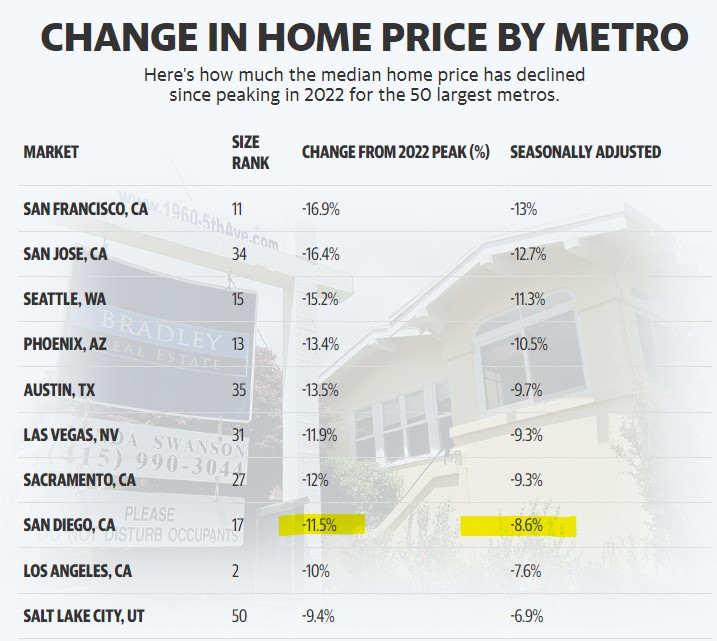
Nov 2022: 390.22 (-7%)
I don’t know where the -7% is happening, but around the NSDCC, the pricing hasn’t changed much.
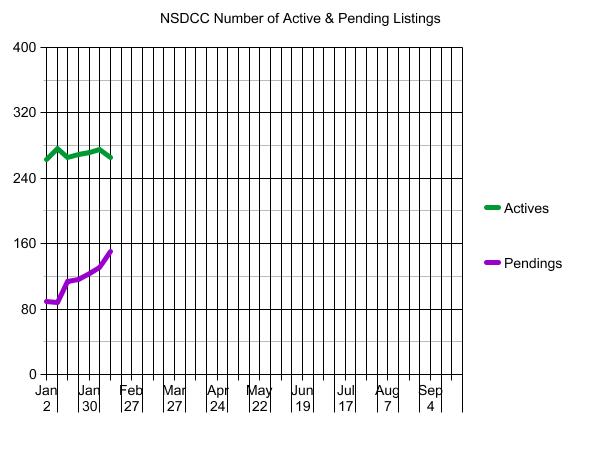
The spring season should run hot through May, and by then the mortgage rates AND prices will probably be higher. The second half of 2023 will likely be sluggish, at best.
According to the Knock Buyer Seller Market Index report, continuing shifts in the U.S. housing market will increase the number of buyers’ markets from 13 to 34 by the end of 2023.
It’s still early days in 2023, and going by the latest data from the Knock Buyer-Seller Market Index, 44 of the 100 largest housing markets favored (or strongly favored) sellers, 44 were neutral, and 13 favored buyers.
That’s actually good news for buyers. A year ago, all 100 of those markets favored sellers.
But over the past 12 months, the slowdown in home sales and home price growth have been shifting the market in buyers’ favor.
According to the Knock Buyer-Seller Market Index, which measures the degree to which each of the 100 largest markets favors home buyers or sellers, based on key housing market metrics, the market has shifted over the past 12 months to change the number of markets favoring buyers from zero to 13. And by the end of 2023, that number is expected to reach 34.
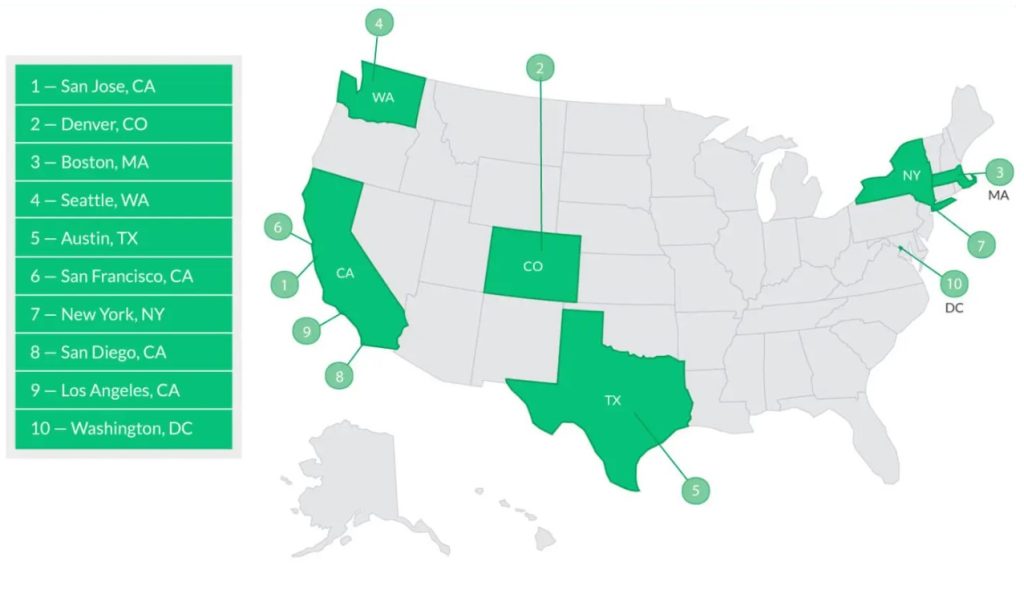
Using data from the Knock index, here are the 10 best markets for buying a home in 2023. The index uses the following six equally-weighted housing metrics, each representing six years of monthly data, to analyze each market:
Average sale-to-ask price ratio—Average calculation of the ratio of final home sale price to asking price.
Number of Homes Sold
Inventory—Number of active listings
Median Days on Market—Median number of days between a property’s listing date and the day it’s removed from the market (when it goes pending).
Median Sale Price—Middle of the home sale price distribution
Months’ Supply—Calculation: number of active listings / months’ supply using a six-month moving average inventory estimate as the denominator (starting June 2017)
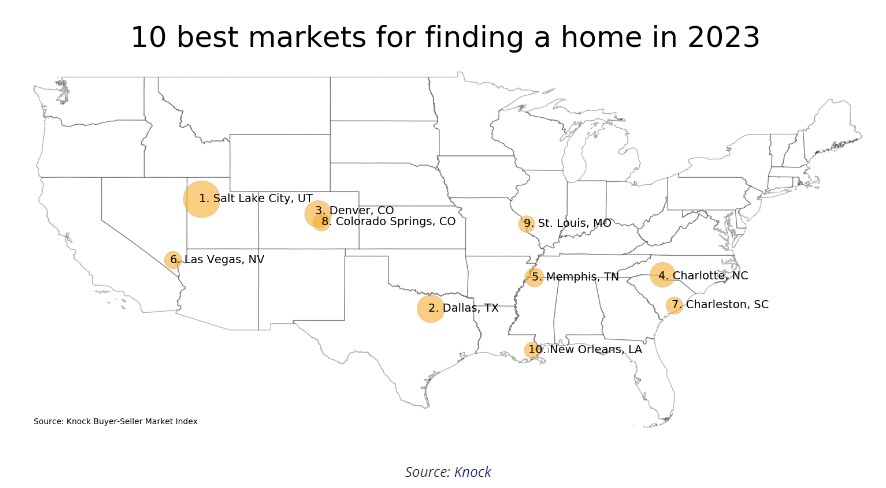
THE TOP 10 MARKETS FOR BUYING A HOME IN 2023
Here are the ten best markets for buying a home in 2023, based on those six key housing market metrics:
Salt Lake City, UT
Dallas–Fort Worth–Arlington, TX
Denver–Aurora–Lakewood, CO
Charlotte–Concord–Gastonia, NC-SC
Memphis, TN-MS-AR
Las Vegas–Henderson–Paradise, NV
Charleston–North Charleston, SC
Colorado Springs, CO
St. Louis, MO
New Orleans–Metairie, LA
WHAT TO EXPECT THIS YEAR: SEASONAL SHIFTS IN KEY HOUSING METRICS
Based on seasonal trends and data for the Knock Index, home buyers are expected to return to the market in greater numbers this spring, creating a window of opportunity for sellers.
Seasonal patterns typically bring an increase in buyer activity in the spring, and with what we’ve seen in January, the market is likely to shift in sellers’ favor in the months ahead before moving decisively in favor of buyers by summer and staying in that direction for the rest of 2023.
Golf-course redevelopment is a terrific solution to providing new housing in the middle of town. They will work out the kinks like building enough roads.
A judge’s ruling halted construction this week of the 536-unit Junipers development in Rancho Peñasquitos — and could complicate and delay approvals of other dense housing projects across San Diego.
Superior Court Judge Ronald Frazier nullified an analysis of how the Junipers would affect nearby traffic, noise and wildfire threats, saying it had failed to account for two large nearby housing projects. In a ruling that made final a tentative ruling he issued last week, Frazier halted construction of the Junipers, where 36 units are complete, and said it can’t resume until the analysis is redone to account for the long-term presence of the 331-unit Millennium PQ and 826-unit Trails at Carmel Mountain Ranch.
The resident group that had sued to stop the Junipers called the ruling a victory for San Diego’s neighborhoods because it will require developers to provide more robust mitigation when they build impactful, dense projects.
In particular, the residents want Junipers developer Lennar Homes to pay for building more evacuation routes for their wildfire-prone area.
“Our goal in bringing this lawsuit forward is to require the city of San Diego to perform environmental review to address wildfire impacts on redevelopment in our area,” the PQ-NE Action Group said in a statement. “We are very pleased with the final ruling.”
The city and Lennar, which declined to comment Tuesday, could appeal to a higher court.
Or Lennar could settle with the residents, for instance by agreeing to construct additional evacuation routes.
If the ruling isn’t overturned on appeal, attorneys for Lennar and the city say it could have far-reaching impacts on how government agencies must analyze the effects dense housing projects might have on traffic, noise and wildfire threats.
“It would potentially grind development to a halt,” Deputy City Attorney Ben Syz told Judge Frazier in court last Thursday. “The city needs certainty as to what it’s looking at and what it’s analyzing.”
There isn’t one standard way to sell a house – every agent does it differently, mostly based on their skill set and ambition in life. My new listing in Spinnaker Hill is a good example!
It’s a tract neighborhood of one-story houses from the 1970s, and most of them haven’t added square footage so comparing the recent sales is fairly simple.
In the post-frenzy environment, appraisers are reluctant to go back more than the standard six months for comparisons, and they will place the most weight on those in the same tract (see above).
The different ways that listing agents sell houses can be broken into three categories:
1. Listing agents who make a deal with the first buyer who calls, and shuts out everyone else.
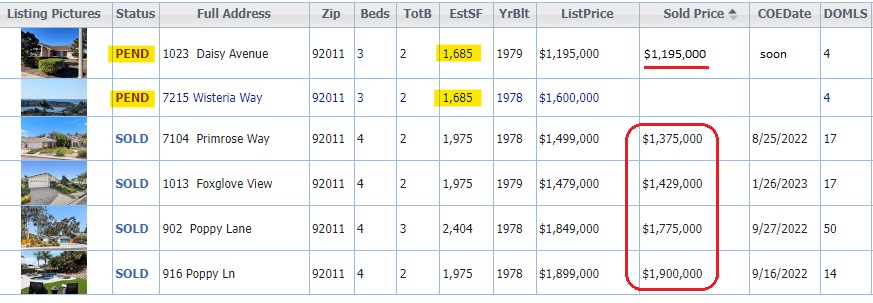
This is what happened when an out-of-town agent listed the home on Daisy that’s pending, which is the identical house to what I’m selling, with less ocean view. It is 100 yards away from my listing, and many people at my open houses asked how I could expect to get $1,600,000 when an identical match was $400,000 less (that buyer lives in the neighborhood and has told everyone about his good fortune).
2. Listing agents who practice the 3P marketing plan (Put a sign in the yard, Put it in the MLS, and Pray).
You can see the varying results in the four recent sales in the post-frenzy era. Nobody knows how long it will take to find a buyer, and what they might be willing to pay – and three out of four took quite a bit less.
3. How Jim the Realtor sells his listings.
I thought the house needed to much work to bother with staging. But it didn’t stop me from recommending a list price that was full retail, or retail-plus – ESPECIALLY with the model match at $400,000 less.
After a vigorous open house extravaganza that 230+ people attended, I received five offers, and four were over the list price. You can tell from the comps that we had a real concern about the appraisal, and it would play a vital role in the decision made by the sellers.
After giving all five of the buyers three chances yesterday to improve their offer, the sellers decided that it boiled down to two contenders:
$1,755,000 cash and no appraisal contingency.
$1,776,000 with a $1,000,000 down payment and no appraisal contingency.
We took the cash deal initially, but the buyer got the yips the next day so we sold to #2.
How much would any other realtor have gotten?
Are you thinking of selling your house? Let’s talk!
Trustindex verifies that the original source of the review is Google.
A+ thank you
Lisa Tuomi
June 11, 2025
Trustindex verifies that the original source of the review is Google.
Many years ago, we purchased a home in Carlsbad, using a realtor that was recommended to us - Jim Klinge. Fast forward to 2025, we recently had the privilege of selling 2 homes in Carlsbad, CA and didn't hesitate to reach out to Jim and Donna Klinge of Klinge Realty Group to guide us through the sales. The transactions were very different, each with its own unique situation, opportunities and challenges. From start to finish, Donna and Jim helped navigate the pre-sale preparation, the listing, showing of the house, buyer negotiations, the final close and all of the paperwork and decisions in between. What stands out with both transactions is the professionalism of Jim and Donna (and their team), wonderful communication (timely, relevant, concise), their deep understanding of market dynamics (setting realistic expectations), their access to top-notch contractors, and last, their ability to guide us across the finish line successfully. We wouldn't hesitate to use Jim and Donna in the future and highly recommend them for anyone looking to buy or sell a property in North San Diego County.
Jerry Meyer
March 28, 2025
Trustindex verifies that the original source of the review is Google.
We sold a home with Jim and Donna and from beginning to end they were consummate professionals. Their initial walk through the property resulted in a list of items to be repaired or updated. They supplied a list of vendors and job quotes to do the repairs and updates. We originally wanted to sell ‘as is’ and just get it over with. They gave us a selling price for ‘as is’ and options for doing a few updates/repairs to doing it all with the selling price for each option. We agreed to do all they suggested and we sold for the exact price they predicted. For every dollar spent we got back more than $2 back in the selling price. And they got that price in a rising interest rate environment! Donna and Jim are extremely detailed and guide you through ever aspect of the sale. There were no surprises thanks to their guidance. We couldn’t be more pleased with their representation.
Thank you Donna and Jim,
Jerry and Mary
Heather Quejada
March 27, 2025
Trustindex verifies that the original source of the review is Google.
We have known Jim & Donna Klinge for over a dozen years, having met them in Carlsbad where our children went to the same school. As long time North County residents, it was a no- brainer for us to have the Klinges be our eyes and ears for San Diego real estate in general and North County in particular. As my military career caused our family to move all over the country and overseas to Asia, Europe and the Pacific, we trusted Jim and Donna to help keep our house in Carlsbad rented with reliable and respectful tenants for over 10 years.
Naturally, when the time came to sell our beloved Carlsbad home to pursue a rural lifestyle in retirement out of California, we could think of no better team to represent us than Jim and Donna. They immediately went to work to update our house built in 2004 to current-day standards and trends — in 2 short months they transformed it into a literal modern-day masterpiece. We trusted their judgement implicitly and followed 100% of their recommended changes. When our house finally came on the market, there was a blizzard of serious interest, we had multiple offers by the third day and it sold in just 5 days after a frenzied bidding war for 20% above our asking price! The investment we made in upgrades recommended by Jim and Donna yielded a 4-fold return, in the process setting a new high water mark for a house sold in our community.
In our view, there are no better real estate professionals in all of San Diego than Jim and Donna Klinge. Buying or selling, you must run and beg Jim and Donna Klinge to represent you! Our family will never forget Jim, Donna, and their whole team at Compass — we are forever grateful to them.
Lou F
March 27, 2025
Trustindex verifies that the original source of the review is Google.
WeI had the pleasure of working with Klinge Realty Group to sell our home in Carmel Valley, and I cannot recommend them highly enough!
Jim and Donna demonstrated exceptional professionalism, offering expert guidance on market conditions and pricing strategy, which resulted in a quick and successful sale.
Communication was prompt and we were well-informed throughout the entire process.
For anyone looking for a dedicated and knowledgeable real estate team, look no further!
---
William Sams
March 25, 2025
Trustindex verifies that the original source of the review is Google.
Donna and Jim Klinge of Klinge Realty Group have our highest possible recommendation. From Donna and Jim’s first visit to our house through closing their advice and counsel was candid and honest in all dealings. They kept us fully informed throughout the process. The house sold less than three days after listing with a two-week closing. My wife and I have sold several houses during our lives. This was by far the best experience. Klinge Reality is a premium service realtor. You can’t make a better choice for someone to sell your home fast and for top dollar.
Emily Hernandez
December 29, 2024
Trustindex verifies that the original source of the review is Google.
Donna and Jim provided exceptional support and professionalism throughout the entire process. We couldn't have been happier with their efforts. They made our house shine, and thanks to their expertise, it sold above the listing price in the very first weekend! Truly a fantastic experience from start to finish.
Jesus Adrian Sahagun
November 11, 2024
Trustindex verifies that the original source of the review is Google.
This year has been difficult on our family, mainly due to having to sell our home. Thankfully we knew God had a plan for us and working with the Klinge team was a key part of it. It was an obvious decision to work with them again after such an amazing experience when purchasing the same home we needed to sell. The challenge was, how will we do this in so little time with so much going on? Jim and Donna held our hand every step of the way. Whenever an unexpected issue arose they found and provided a solution. Never once did we feel pressured to make a decision and the Klinges were always reassuring after providing the information that the decision was ours to make. Despite the curve balls, they never panicked and exemplified the “can do” attitude, making us feel optimistic and taken care of. Their expertise and professionalism was superb. But of all the reasons to work with the Klinges, the most impactful and valuable is their compassion and genuine care for their clients. We pray that we can one day purchase our forever home and you better believe that Jim and Donna will be representing us - as long as they will have us of course. Thank you again Klinge team! Your execution, experience, and care are unmatched.
SABIHA PASHA
July 23, 2024
Trustindex verifies that the original source of the review is Google.
Jim and Donna were fantastic! Jim understanding my needs, recommending potential places, pointing out the pros and cons of each property was invaluable. Then when the offer was accepted Donna’s organized guidance through the inspections, paperwork etc made the whole process seem effortless.
So grateful that I had them on my side!
Anu Koberg
July 13, 2024
Trustindex verifies that the original source of the review is Google.
We first found Jim through his blog at bubbleinfo.com, which really showcased his knowledge of SoCal real estate. Since then we've done three transactions with Jim and Donna, and they are an incredible full service agency, with Jim's deep market insight and Donna's deft contract and project management. We trust them implicitly in their analysis and strategy, which is based on years of experience. They're always available and on top of things, and we strongly recommend them to anyone.