by Jim the Realtor | Sep 3, 2018 | Inventory, Jim's Take on the Market, NSDCC Pendings |
The NSDCC Actives vs. Pendings by price range:
| Price Range |
NSDCC Actives |
NSDCC Pendings |
A:P Ratio |
Avg. DOM |
| Under $1.0M |
109 |
62 |
2 to 1 |
38 |
| $1.0M to $1.5M |
207 |
129 |
2 to 1 |
45 |
| $1.5M to $2.0M |
172 |
64 |
3 to 1 |
67 |
| Over $2.0M |
541 |
65 |
8 to 1 |
105 |
In the past, we’ve considered a ratio of 2:1 to be about normal. Given this market and time of year, these look pretty good, except for the high-end which has always had excess supply. (more…)
by Jim the Realtor | Jul 18, 2018 | Jim's Take on the Market, North County Coastal, NSDCC Pendings, Sales and Price Check
Let’s examine by zip code where the market might be slowing recently. These are the detached-home sales for the second quarter, plus the current number of pendings in each area:
| Area |
Zip Code |
Sales 2Q16 |
Sales 2Q17 |
Sales 2Q18 |
Pendings Today |
| Cardiff |
92007 |
25 |
30 |
11 |
9 |
| Carlsbad NW |
92008 |
49 |
67 |
67 |
20 |
| Carlsbad SE |
92009 |
161 |
181 |
148 |
64 |
| Carlsbad NE |
92010 |
49 |
51 |
47 |
26 |
| Carlsbad SW |
92011 |
80 |
91 |
60 |
26 |
| Del Mar |
92014 |
55 |
45 |
47 |
8 |
| Encinitas |
92024 |
144 |
141 |
110 |
51 |
| La Jolla |
92037 |
113 |
105 |
104 |
42 |
| RSF |
92067 |
76 |
79 |
55 |
43 |
| Solana Bch |
92075 |
19 |
33 |
21 |
10 |
| Carmel Vly |
92130 |
173 |
153 |
166 |
55 |
| All Above |
All |
944 |
976 |
836 |
354 |
If the numbers for 2Q18 are remarkably under the first two columns, and the number of pendings are so low that the 3Q18 doesn’t look promising either, then you can figure that the market is soft, and getting softer in that zip code (Cardiff, Carlsbad SW, & Encinitas).
by Jim the Realtor | Jul 16, 2018 | Actives/Pendings, Jim's Take on the Market, North County Coastal, NSDCC Pendings
Historically, we have considered our market to be relatively ‘healthy’ when the actives-to-pendings ratio is around 2.0 – but that thought originated when prices were about half of what they are today!
But all in all, we’re in pretty good shape today.
The active inventory hasn’t exploded, and as long as the supply stays in check, the sellers aren’t going to panic. Do the buyers have the willingness and ability to wait it out, with no assurance it will ever get better? Or will the lack of solid evidence keep the ball rolling, albeit at a slower pace?
Here are the stats for the NSDCC detached-home market (La Jolla to Carlsbad):
| Reading Date |
Actives |
Pendings |
A+P |
A/P |
| Oct 28, 2015 |
970 |
358 |
1,328 |
2.71 |
| Feb 1, 2016 |
788 |
254 |
1,042 |
3.10 |
| Mar 23, 2016 |
900 |
399 |
1,299 |
2.26 |
| June 21, 2016 |
1,052 |
428 |
1,480 |
2.46 |
| Aug 17, 2016 |
1,060 |
395 |
1,455 |
2.68 |
| Dec 4, 2016 |
886 |
327 |
1,213 |
2.71 |
| Apr 21, 2017 |
842 |
427 |
1,269 |
1.97 |
| July 16, 2018 |
973 |
357 |
1,330 |
2.73 |
NSDCC Actives Median Price = $2,288,045
NSDCC Pendings Median Price = $1,395,000
Only 10% of the actives are under $1,000,000, and 35% are over $3,000,000 (which are the same ratios as the last reading in April, 2017).
Here are the Actives/Pendings ratios for each area:
| Area |
Zip Code |
June |
Aug |
Dec |
Apr |
Act/Pend Today |
| Cardiff |
92007 |
2.3 |
3.5 |
1.1 |
1.0 |
2.5 |
| Carlsbad NW |
92008 |
2.0 |
2.3 |
1.3 |
1.2 |
2.9 |
| Carlsbad SE |
92009 |
1.6 |
2.0 |
1.9 |
1.0 |
1.3 |
| Carlsbad NE |
92010 |
0.7 |
0.9 |
1.3 |
0.9 |
1.1 |
| Carlsbad SW |
92011 |
1.6 |
1.5 |
1.3 |
1.1 |
2.4 |
| Del Mar |
92014 |
3.2 |
2.5 |
4.9 |
3.3 |
9.4 |
| Encinitas |
92024 |
1.3 |
1.8 |
1.8 |
1.6 |
2.0 |
| La Jolla |
92037 |
4.8 |
4.4 |
4.4 |
3.7 |
4.4 |
| RSF |
92067 |
8.2 |
6.3 |
6.3 |
5.2 |
4.6 |
| Solana Bch |
92075 |
2.9 |
3.9 |
2.7 |
1.5 |
2.0 |
| Carmel Vly |
92130 |
1.5 |
1.8 |
1.8 |
1.1 |
1.9 |
| All Above |
All |
2.5 |
2.7 |
2.7 |
2.0 |
2.7 |
These stats are going to bounce around, so there isn’t anything here that gets me overly concerned.
Del Mar has always been a smaller, expensive subset (just eight pendings today), La Jolla is in line with their recent past, and RSF is as good as it’s been in years. Everything else is around the regular 2.0 ratio for a normal market.
by Jim the Realtor | Jul 9, 2018 | Inventory, Jim's Take on the Market, North County Coastal, NSDCC Pendings, Sales and Price Check |
The pending counts have been dropping precipitously since June 11:
NSDCC All: -15%
Under-$1,000,000: -29%
While a lower number of pendings can be due to more closings from the fat part of the selling season, it not like we’re setting any sales records either. The NSDCC June sales are down 20%, year-over-year, just like they were in May.
Get Good Help!
(more…)
by Jim the Realtor | Apr 2, 2018 | Inventory, Jim's Take on the Market, North County Coastal, NSDCC Pendings

Here are the new actives and pendings for the last six weeks, and how they compare to previous years:
| Week |
2015 A/P |
2016 A/P |
2017 A/P |
2018 A/P |
| Feb |
83/64 |
80/72 |
66/73 |
87/57 |
| Mar |
99/68 |
123/52 |
102/66 |
84/62 |
| Mar |
93/76 |
101/75 |
99/59 |
107/67 |
| Mar |
101/84 |
90/75 |
93/82 |
88/59 |
| Mar |
89/81 |
94/64 |
82/60 |
99/55 |
| Apr |
80/58 |
112/72 |
104/70 |
87/66 |
| Totals |
545/431 |
600/410 |
546/410 |
552/366 |
The new pendings this year are about 10% below the last couple of years, and the common explanation you see in the media points to the lack of inventory.
But we’re having about the same number of listings between La Jolla and Carlsbad, they are just high-enders – the median LP currently is $2,495,000.
(more…)
by Jim the Realtor | Feb 6, 2018 | Jim's Take on the Market, North County Coastal, NSDCC Pendings, Sales and Price Check |
Let’s look closer at the individual neighborhoods, and compare annual sales and pricing between 2016 and 2017:
| Town |
Zip Code |
2016 Sales |
Avg $$/sf |
Med SP |
2017 Sales |
Avg $$/sf |
Med SP |
| Cardiff |
92007 |
82 |
$711 |
$1,407,500 |
76 |
$711 |
$1,300,000 |
| NW C-bad |
92008 |
220 |
$465 |
$897,400 |
189 |
$429 |
$875,000 |
| SE C-bad |
92009 |
498 |
$343 |
$900,000 |
531 |
$363 |
$981,000 |
| NE C-bad |
92010 |
162 |
$343 |
$731,250 |
168 |
$367 |
$804,402 |
| SW C-bad |
92011 |
280 |
$393 |
$935,000 |
275 |
$413 |
$999,000 |
| Crml Vly |
92130 |
540 |
$409 |
$1,144,500 |
486 |
$441 |
$1,218,400 |
| Del Mar |
92014 |
162 |
$966 |
$1,787,500 |
163 |
$814 |
$1,800,000 |
| Encinitas |
92024 |
499 |
$530 |
$1,185,000 |
446 |
$568 |
$1,212,250 |
| La Jolla |
92037 |
354 |
$829 |
$1,918,250 |
328 |
$846 |
$2,172,500 |
| RSF |
67+91 |
251 |
$512 |
$2,272,500 |
284 |
$494 |
$2,240,000 |
| Solana B |
92075 |
86 |
$708 |
$1,310,000 |
98 |
$786 |
$1,500,000 |
| NSDCC |
All Above |
3,103 |
|
$1,160,000 |
3,075 |
|
$1,225,000 |
| SanMarcosSo. |
92078 |
529 |
$291 |
$679,000 |
530 |
$316 |
$730,000 |
| PB/MB |
92109 |
226 |
$673 |
$1,082,500 |
225 |
$755 |
$1,195,000 |
| West RB |
92127 |
561 |
$343 |
$900,000 |
615 |
$366 |
$1,050,000 |
| East RB |
92128 |
533 |
$347 |
$660,000 |
513 |
$371 |
$725,000 |
| RP |
92129 |
450 |
$338 |
$720,000 |
374 |
$380 |
$759,500 |
| Scripps R |
92131 |
333 |
$340 |
$830,000 |
320 |
$367 |
$910,000 |
The velocity is slowing a bit from previous years. Of the 17 areas:
- Ten had fewer sales in 2017.
- Three had a lower cost-per-sf in 2017.
- Three had a lower median sales price in 2017.
Rancho Santa Fe had the cost-per-sf and median sales price dip slightly, but the annual sales were up 13%. NW Carlsbad had sales, cost-per-sf, and median SP all go down.
The current market conditions are very positive, especially on the lower-end of North San Diego County’s coastal region.
Of the houses listed under $1,500,000, there are 151 actives and 167 pendings, which is fantastic. The market of houses listed over $1,500,000 is more sluggish, with 493 actives and 102 pendings.
Get Good Help!
by Jim the Realtor | Nov 30, 2017 | Jim's Take on the Market, Market Buzz, North County Coastal, NSDCC Pendings |
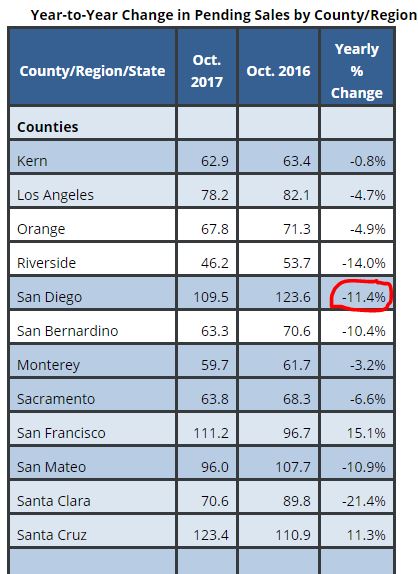
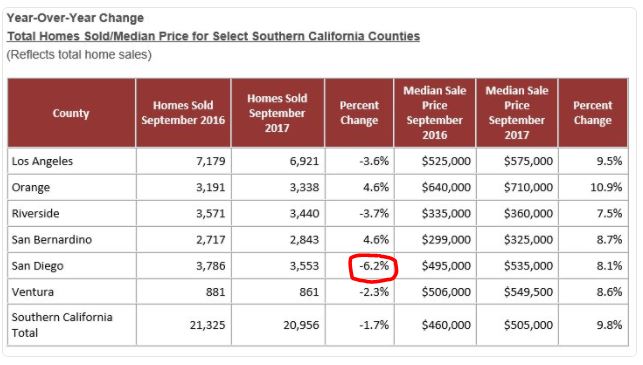
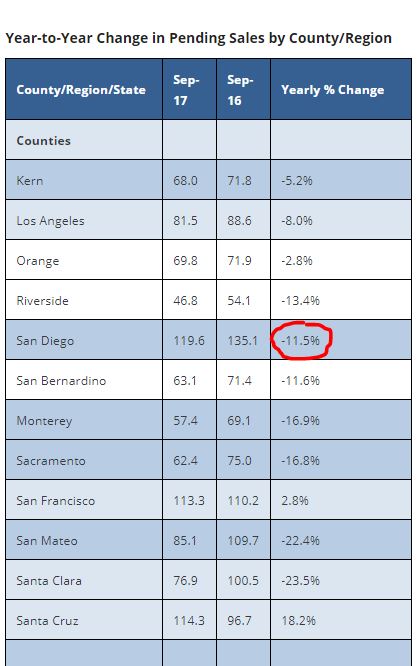
I’m not sure how the C.A.R prognosticators can look at these Y-o-Y numbers and still forecast higher sales for next year – unless they think the supply will inflate with thousands of desperate realtors having to sell their own homes?
LINK
The North County Coastal region (La Jolla to Carlsbad) is doing well, considering that December begins tomorrow – only a 17% drop since summer:
August 22nd: 373 pendings, 194 at 20+ days on market
November 30th: 309 pendings, 196 at 20+ days on market
There is no telling how many homes will come to market next year, or if there will be buyers willing to pay the usual Comps+5% pricing.
Get Good Help!
by Jim the Realtor | Nov 2, 2017 | Jim's Take on the Market, Market Conditions, North County Coastal, NSDCC Pendings |
The data keeps pointing to a slowdown, and like a Yu Darvish hanging curveball, once it’s in flight, there’s not much you can do. Few sellers need to sell bad enough that a substantial price reduction will be considered – and there isn’t enough competition to cause any fear. For buyers who keep reading about the threat of rising rates, it can be very frustrating.
Here’s how the C.A.R. describes it:
• Pending home sales have declined on an annual basis for eight of the last nine months so far this year. After a solid run-up of closed sales in May, June, and August, continued housing inventory issues and affordability constraints may have pushed the market to a tipping point, suggesting the pace of growth will begin to slow in the fall.
• C.A.R.’s Market Velocity Index – home sales relative to the number of new listings coming on line each month to replenish that sold inventory, or market indicator of future price appreciation – suggests that there continues to be upward pressure on home prices through the fall. Home sales continue to outstrip new listings coming online to restock sold units.
• The Market Velocity Index dipped from 53 to 52, implying that there were 52 percent more homes sold than new listings, meaning the supply of homes available for sale continued to drop.
However, fewer homes are coming to market, in spite of record pricing:
NSDCC # of Houses Listed Between August 1 – September 30th:
2016: 848
2017: 738
Diff: -13%
All SD County # of Houses Listed Between August 1 – September 30th:
2016: 6,006
2017: 5,346
Diff: -11%
NSDCC # of Houses Listed In September Only:
2016: 413
2017: 337
Diff: -18%
All SD County # of Houses Listed In September Only:
2016: 2,836
2017: 2,473
Diff: -13%
With fewer homes to sell, the percentages of pending and closed sales have nowhere to go but down – and we’re doing fine, considering the inventory. The declines in the pending and closed sales are in line with, or better than the decline in new listings.
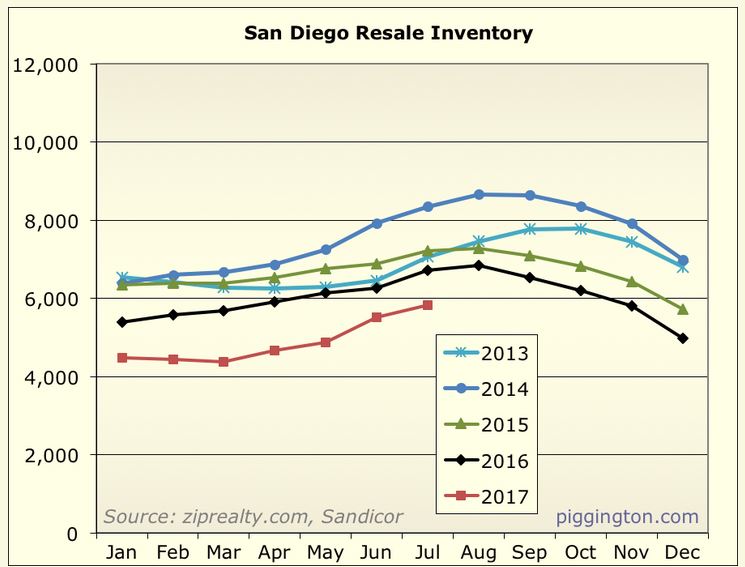
by Jim the Realtor | Aug 22, 2017 | Jim's Take on the Market, NSDCC Pendings, Rich Toscano |
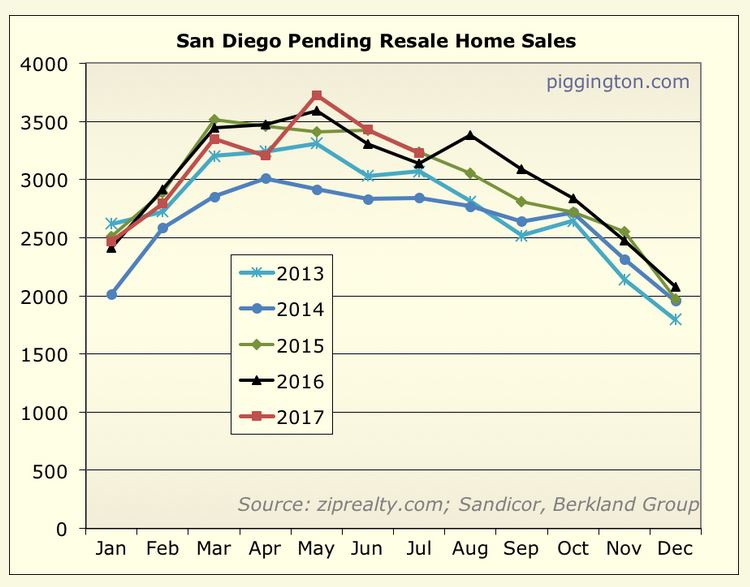
Rich has his latest report on the San Diego stats:
https://piggington.com/july_2017_housing_data_chartsngraphs
In his graph above, you can see that the county has been cooking this summer, with as many pendings as we’ve had in recent years!
In spite of higher pricing, we’ve also had fewer homes to consider. Isn’t it mind-boggling that in a county of more than 3 million people, we’ve had less than 6,000 homes for sale all year?
We’ve been following the weekly new pendings between La Jolla and Carlsbad since 2013, but I haven’t monitored the NSDCC total pendings. Any rise and fall in the total-pendings count would be a precursor to a change in sales count, which would give us a hint of a new trend.
The NSDCC pendings count has been in the 400s over the last few months, so as summer winds up, these numbers aren’t surprising:
NSDCC Total Pendings today: 373
NSDCC Pendings, 20+ Days: 194
The houses that are still pending after 20 days have probably released their contingencies, and are on their way to the finish line. I will keep track of them from now on to see if the trend reveals anything new!