Worried about wildfire exposure and frustrated by state regulations, insurers in California have been cutting back on their homeowner businesses. Now, affluent homeowners are feeling more of the pain, as two of the biggest firms offering protection for multimillion-dollar properties end coverage for some customers.
As early as this month, American International Group Inc. will begin notifying about 9,000 customers in its Private Client Group that their home policies won’t be renewed this year. The change is part of a plan by AIG to cease selling home policies in California through a unit regulated by the state’s insurance department.
AIG told insurance brokers in an email late last year that some policyholders instead may be eligible for coverage via another AIG unit. The other unit operates alongside other so-called excess-and-surplus lines insurers, which have more freedom on policies’ rates and terms than do insurers in the broader, tightly overseen home-insurance market.
The policies could cost three to five times what AIG’s clients now pay, with less-generous coverage, brokers said.
“AIG is the first high-net-worth carrier to say ‘we’ve had it, we’re divorcing ourselves from California’s regulated market,’ ” said Jim Tolliver, an insurance broker in San Francisco with Woodruff Sawyer & Co., who fears others will follow suit.
Chubb Ltd. the biggest high-end insurer in the state, is continuing to non-renew some policies. But, “we are still accepting new customers across the state in areas where we have a fair chance of earning an adequate return,” Paul Krump, a Chubb vice chairman, said last week.
In an earnings call in October, Chubb Chief Executive Evan Greenberg said the insurer’s California shrinkage was “not a small amount” in locations “both highly exposed and even moderately exposed to wildfire.” He said “someone else will have the pleasure of writing” business for which “we cannot charge an adequate price for the risk.”
Chubb, which declined to provide policyholder figures, aims to offer excess-and-surplus policies to many policyholders who aren’t renewed.
The moves by AIG and Chubb follow years of non-renewals by mass-market insurers. California regulators have been encouraged that parts of the broader market are showing signs of stabilizing, thanks to recent rate increases. Allstate Corp. , Farmers Insurance and some others have committed to adding policyholders.
Some insurers are frustrated that California regulators require them to set home-insurance rates based on their historical loss experience, not projections of future losses that are determined by catastrophe modeling. Such models can reflect detailed, location-specific data that the insurers feel they need amid escalating wildfire activity tied partly to climate change.
Jerry Ryan asked our insurance expert, Suzanne Canfield, for her thoughts:
If your home is near any sort of brush, forget about finding insurance with a preferred-market carrier. The areas affected in San Diego are Rancho Santa Fe, Carmel Valley, Fallbrook, Escondido, La Mesa, Alpine etc. The Los Angeles area is extremely difficult. I work for an independent brokerage firm and almost all of our preferred markets will deny writing business in such areas. I have to refer many markets to State Farm who continues to write homes in these areas until they are too saturated. Or the other options is finding a non admitted insurance solution who’s rates and filings are not implemented by the state, coverage is lacking and premiums are much higher. If you cannot get a quote form a non admitted carrier, the CA Fair Plan is the last resort and they are capped at a total insurance value of only $3 million.
How about people that have property next to canyons?
Don’t be surprised if they receive a notice of non-renewal due to a change in underwriting that the company has taken to mitigate fire losses on that particular area. Many of clients are either being non-renewed for this very reason or the company is choosing to pull out of CA completely. These companies are AIG which specializes in insuring million dollar homes and Nationwide Private Client. AIG and CHUBB insure many celebrities in the Hollywood hills and throughout LA. Trust me, insurance companies don’t have favorites either. Word is that Oprah’s home is getting non-renewed by either CHUBB or AIG.
Is there a map on “highly impacted fire areas” similar to flood plains?
Not that I am aware of. Nowadays companies use google maps and other tools to view homes. And if there are any adjacent canyons or open space, they consider it a fire prone are.
Can new owners in affected areas get fire insurance?
Yes through the CA Fair Plan. The CAFP only covers the home for Fire and Vandalism. Whereas a typical homeowners policy includes liability and water damage. In conjunction with the CAFP policy, homeowners must purchase what’s called a wrap around policy or difference in conditions policy to supplement it.
How much are premiums rising, with rising home equity?
Premiums are rising based on where you live. If you live in an area near brush, expect your premium to rise at minimum 10% but more often I see 20% and I have seem premiums double. Insurance companies choose to take more and more rate to make up for all of the wildfire claims paid out over the last several years. And it’s going to continue to get worse before it gets better.
Need insurance? Contact Suzanne at: suzanne.canfield@hubinternational.com
One sign isn’t going to change the world, but it’s an example of how home sales will be changing in the future. If/when homes are sold in-house (not exposed to outside brokers and buyers) like commercial properties, Compass should extend its dominance in San Diego County – especially north coastal.
I can’t control how this turns out; I can only roll with it!
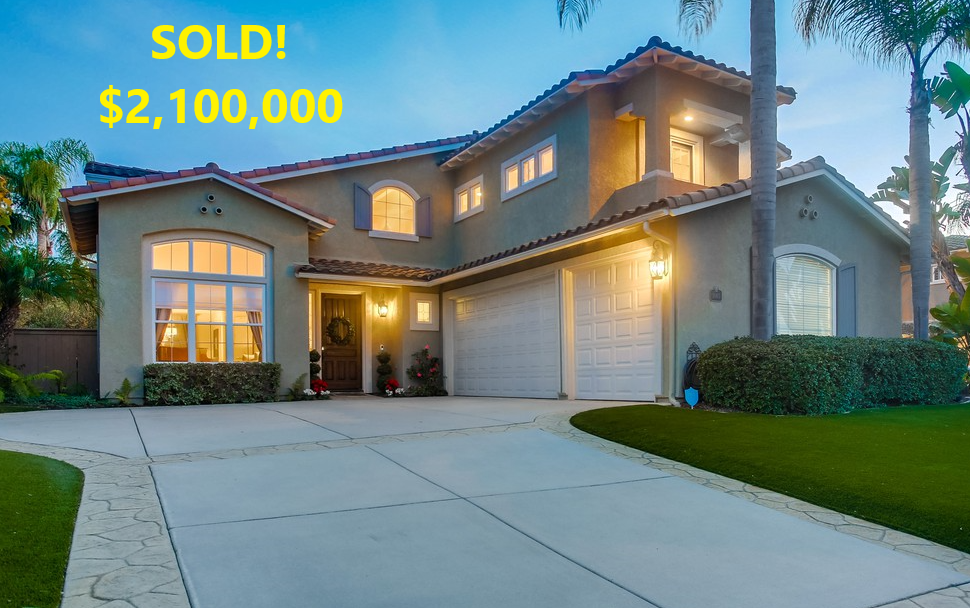
This is the house I featured here when it went on the market on January 12th. It was a little early for the usual selling season but the market has been so hot over the last three months that we dove right in.
The numbers:
Model-match sale across the street in May: $1,450,000 (the list price was $1,299,000)
Realtor.com estimate of my listing: $1,531,100
Zestimate: $1,549,500
Our list price: $1,795,000
Five offers: between $1,800,000 and $1,950,000
Other agents would have grabbed the $1,950,000 and been happy. It was a half-million over the comp!
But I was just getting started. I encouraged every bidder to raise their offer by sending each of them a written counter asking for their highest-and-best offer.
The key point?
The winner who paid $2,100,000 was the buyer who made the lowest offer originally.
In 2021, the practice of countering buyers for their highest-and-best offer went by the wayside. If listing agents do counter, the latest practice is to only counter the top 2-3 offers and ignore the rest.
If I would have done that on this listing, I would have left $150,000 on the table! When the sixth offer arrived late, I still gave them ample opportunity to bid higher too.
When you get multiple offers, you want me in your corner.
Are you thinking of selling? Contact me at 858-997-3801, or klingerealty@gmail.com.
This guy has been drunk on the doom juice for so long that he must never get out of his bunker!
If he did, he would see the overwhelming demand for every new listing, even though underwriting standards are strict and rates are going up. Of the 140 NSDCC sales last month, 36% were all-cash.
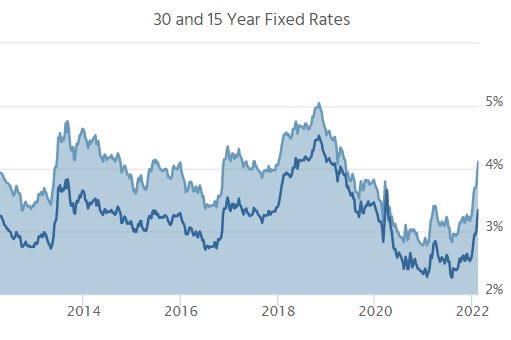
Last Friday was an interesting day for mortgage rates and the broader bond market. Rates began the day roughly in line with Thursday’s latest levels, but bonds lost ground throughout the morning. Multiple lenders adjusted rates higher before 1:30pm. After that, headlines made the rounds regarding the potential Russian invasion of Ukraine, which sent bond yields lower. By the end of the day, many lenders adjusted rates slightly lower.
The new week began with Russian Foreign Minister Lavrov making a series of comments that helped to moderate the more dire tone from Friday. Markets followed in lock step with rates rising to undo a majority of Friday’s improvement. This left the average mortgage lender roughly in line with Friday’s highs. That equates to 30yr fixed rates over 4.0% for most scenarios.
Russia/Ukraine headlines continued throughout the day. Although this did cause some volatility at times, markets progressively tuned out. Moreover, geopolitical risk is not destined to be the key market moving consideration unless things get appreciably worse. Even then, the primary narrative remains focused on inflation and the Fed’s evolving policy response.
Even with the list prices reflecting massively-inflated values, nearly half of the homebuyers felt the need to pay over the list price lately:
NSDCC Detached-Home Sales, % Closed Over List Price
January: 38%
February: 43%
March: 53%
April: 55%
May: 54%
June: 59%
July: 64%
August: 55%
September: 41%
October: 45%
November: 48%
December: 48%
January: 49%
There were another 15% who paid full price in January, so almost two-thirds paid all the money. There were 16 listings that sold with zero days on market too.
~~~~~~~~~~~~~~~~~~~~~~~~~~~~~~~~~~~~~~~~~~~~~~~
Percentage Of Sales Over List Price by Price Range
Price Range
March
April
May
June
July
Aug
Sept
Oct
Nov
Dec
Jan
$0 – $1.0M
76%
79%
89%
88%
89%
88%
64%
78%
71%
88%
50%
$1.0M – $1.5M
68%
78%
84%
75%
74%
74%
37%
64%
64%
76%
82%
$1.5M – $2.0M
66%
66%
72%
66%
82%
73%
61%
58%
56%
50%
67%
$2.0M – $3.0M
54%
32%
34%
66%
56%
56%
36%
38%
46%
20%
33%
$3M+
16%
22%
22%
17%
26%
19%
24%
7%
22%
13%
26%
~~~~~~~~~~~~~~~~~~~~~~~~~~~~~~~~~~~~~~~~~~~~~~~
The January sales were a little soft, historically, but the inventory has been decimated:
NSDCC January Sales
2017: 174
2018: 149
2019: 150
2020: 182
2021: 187
2022: 140
~~~~~~~~~~~~~~~~~~~~~~~~~~~~~~~~~~~~~~~~~~~~~~~
NSDCC Average and Median Prices
Month
# of Sales
Avg. LP
Avg. SP
Median LP
Median SP
Feb
224
$2,298,797
$2,257,334
$1,719,500
$1,758,000
March
252
$2,295,629
$2,260,524
$1,800,000
$1,825,000
April
357
$2,396,667
$2,403,962
$1,799,900
$1,828,000
May
300
$2,596,992
$2,581,715
$1,900,000
$1,994,500
June
348
$2,509,175
$2,537,953
$1,900,000
$1,967,500
July
311
$2,421,326
$2,442,738
$1,795,000
$1,855,000
Aug
268
$2,415,075
$2,438,934
$1,897,000
$1,950,000
Sept
278
$2,479,440
$2,445,817
$1,899,000
$1,987,500
Oct
248
$2,754,470
$2,705,071
$1,899,000
$1,899,500
Nov
199
$2,713,693
$2,707,359
$1,999,000
$2,100,000
Dec
189
$2,686,126
$2,664,391
$1,985,000
$2,157,500
Jan
140
$2,828,988
$2,855,213
$2,234,944
$2,240,000
The average sales price went up 7% MoM.
The median sales price went up 4% MoM.
The local pricing flattened out last summer, only to be revived over the last three months.
It should be a crazy spring – probably the craziest ever!
The Super Bowl is complete, and the spring selling season begins today!
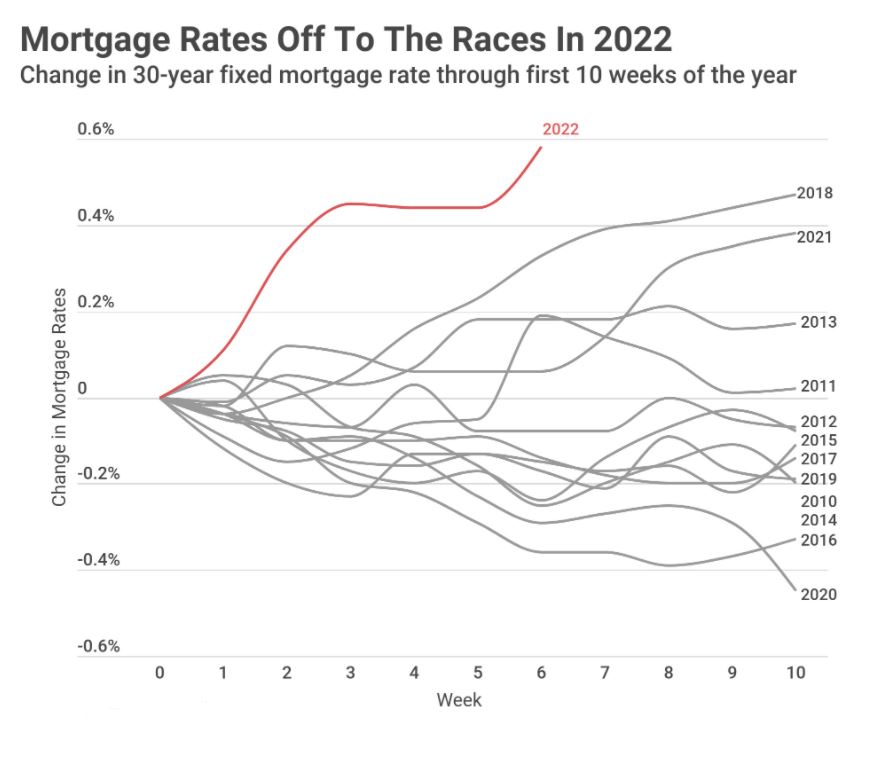
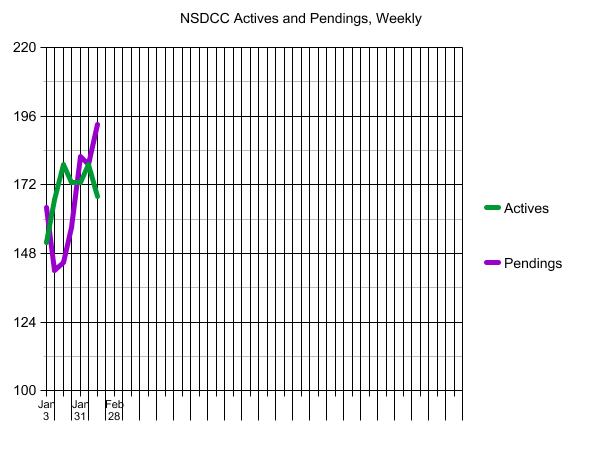
Judging by the quick jump in the total number of pendings, homebuyers aren’t waiting around. Mortgage rates have risen faster than any time in the last dozen years, and the number of homes for sale is scary low:
There was heavy activity over the weekend, and on the hot buys, the offers seemed to be starting at 10% over the list prices – which is now the new normal. Waiving contingencies and giving sellers free rentbacks for 60 days will be part of the landscape for the next few months.
Will rising rates cool off the market? Only for those who are on the fringes and sensitive to payment shock. The affluent – the buyers who are controlling the market – are less impacted, and a measly 1% rise in your loan rate only changes the payment by $1,116 per month on a $2,000,000 mortgage.
How long will the 2022 frenzy last?
It should stay hot until one of the following happens:
Mortgage rates hit 5%
A flood of inventory
Mid-summer
By summertime, the pool of highly-motivated buyers should be diminishing, and we’ll be left with those who haven’t been willing to pay these prices. Remember that when you see another crazy-high sales price, there was only one buyer who was willing to pay that much – the rest all wanted to pay less!
The number of NSDCC active listings has been in a tight range of 167-179 over the last six weeks – which means there is a strong surge of new pendings, evidenced by the purple line racing upward. The number of homes in escrow has grown from 142 on January 10th to 193 today!
As of today, the number of new listings in January is 201, which means it looks like Daniel is going to be the winner, and will receive four tickets to a Padres game…..if there is a season.
The guesses:
142 The other Bob
181 Eddie89 201 Daniel Nicolas
210 Drew
215 Joe
222 Majeed
230 Lifeisradincbad (who was a winner last year)
237 Curtis Kaiser
245 doughboy
250 Deckard Mehdy
259 Susie
260 Derek (the other winner last year and only missed by 1)
270 Skip
278 Haile
286 Matt
290 Esteban del Rio
294 Tom
295 Rob Dawg
300 BWell_SoCal
312 big T
325 Mortgage Guy
373 Rob
The 201 is a 30% drop from the January, 2021 count, and you remember how tight the inventory was last year. Hopefully the pandemic is the cause, and we bounce back to have as many listings as we had last year?
Year
Annual Number of NSDCC Detached-Home Listings
2017
4,637
2018
4,840
2019
4,741
2020
4,494
2021
3,618
Remember when we thought the dip in 2020 was a temporary covid decline? Yikes!