She mentioned that the supply of San Diego homes for sale has risen a “whopping 31%” year-over-year, and in an instant judgment, says, “You can bet those prices will ease more – the question is, will they go negative?”
(their map now says that our inventory is up 44% Y-o-Y)
With no other explanation, it’s easy to conclude that the sky is falling. Is it?
They are using the Zillow seasonally-adjusted numbers for September:
September
Active Inventory
% change
2010
13,533
x
2011
15,749
+16%
2012
8,475
-46%
2013
6,136
-28%
2014
8,839
+44%
Yep, the inventory was 44% higher than it was than last year – when summer’s interest-rate rise caused buyers to gobble up anything resembling a decent buy, leaving the cupboard bare in September. To ignore that fact is short-sighted, especially when you compare to recent history.
When you compare the total number of listings for the first 10 months of the year, you don’t see much of a flood either – only a 3% increase Y-o-Y, and all of those could be re-lists:
2013: 42,746
2014: 44,234
Don’t make decisions just based on the soundbites – look deeper to separate the facts from the hysteria. Get good help!
We lost our other TV-news favorite – Larry Himmel passed away from brain cancer on Wednesday. We remember him reporting on his own house burning down in the 2007 Witch Creek Fire:
We saw this week that the local seasonally-adjusted Case-Shiller Index has been trending negative since April. Here we see how the recent gains have been driven by the lower-end properties:
The difference could simply be a percentage thing – a home’s value that goes from $300,000 to $400,000 has risen 33%, while a $700,000 home that goes up to $800,000 has only increased 14%.
But the underlying story is that the upper-end home values haven’t done much over the last 18 months.
As in 2010, today’s price movement is the tail end of a mini-bubble, set into motion some 18 months earlier. This price rise was produced by short-lived speculator interference in 2013 (not a tax stimulus, as in 2009). This pricing activity is under pressure from insufficient personal incomes, rising fixed-rate mortgage (FRM) rates and new construction.
Prices are expected to continue to fall in the coming months, bottoming in 2015 and retreating toward the mean price trendline. The cooling of speculative fever and continually rising mortgage rates will prolong the falling trend in sales volume, pulling prices down in turn. Remember, real estate prices track and run with bond prices due to interest rate movement. A lag time of a couple of months exists due to remaining perceptions of past real estate price movement — the sticky price phenomenon.
The NAR convention starts tomorrow in New Orleans, and for those who would like a preview – and want a peek behind the NAR curtain – read this great post by the Notorious Rob:
San Diego is mentioned in this cnbc piece, which wraps up with a quote that could become a self-fulfilling prophecy – “Buyers are in the drivers seat”:
There will still be a few stragglers, but the October numbers are shaping up as expected – fewer sales but healthy pricing. The frenzy was zooming by the end of 2012, but it was settling down by October 2013 after rates popped that June.
Here are the last 11 NSDCC Octobers, for comparison:
October
# of Sales
Median SP
Avg $/sf
Avg DOM
# over $3M
2003
306
$778,500
$369/sf
57
11
2004
229
$895,000
$453/sf
63
12
2005
218
$1,065,000
$468/sf
60
16
2006
186
$888,762
$424/sf
83
11
2007
145
$920,000
$483/sf
75
13
2008
195
$800,000
$406/sf
74
12
2009
211
$805,000
$407/sf
86
7
2010
188
$854,750
$364/sf
79
6
2011
186
$835,000
$379/sf
85
11
2012
297
$825,000
$388/sf
77
10
2013
266
$957,500
$495/sf
57
16
2014
235
$982,655
$468/sf
60
12
Look how similar this year is to 2005. After two years of spectacular run-up in both cases, we’re at the identical $/sf.
With rates bobbing around 4%, our softer landing should continue.
The folks at Case-Shiller used to publish both the seasonally-adjusted, and non-seasonally-adjusted numbers, but lately they have just gone with the non-seasonally-adjusted only.
The non-seasonally-adjusted index just posted its first month-over-month decline, but the seasonally-adjusted numbers (which Bill McBride prefers) for San Diego have been dropping since April:
“At first, they were a little leery,” she recalled. “They’d say, ‘OK. I’ll buy one property as an investment.’ Six months later they were amazed at how much they were getting back. They call and say, ‘I want to buy more.'”
Today, the transpacific trade in Southern California real estate is big business. Chinese citizens bought $22 billion worth of homes in the United States in the 12 months that ended in March, according to estimates by the National Assn. of Realtors. And with its direct flights to China and large Asian communities, the Southland is their favorite destination.
They’re buying homes for themselves to emigrate, for their children to attend college, or for rental income. Neighborhoods from Irvine to Arcadia are being transformed.
Chen now employs eight people — who, combined, speak eight languages — to buy and manage properties. She has offices in Irvine, Chino and Taiwan. When she hears grumbling about Chinese money pricing out American home buyers, she notes that it helped revive the housing market, and that all those transactions keep people working at banks and title companies and contractors.
“This has created a lot of jobs,” she said.
But even she’s starting to wonder how much longer this influx of cash from across the Pacific will last. The Chinese government keeps making noise about clamping down on currency leaving the country. The U.S. government is talking about taxes on foreign investors, which could make buying here a little less attractive. Buyers are starting to get a bit spooked. And there’s only so many of these deals she can do.
All that has Chen wondering what trend might come next.
“I think I’m not going to be putting as much energy into this,” she said. “I think the next few years are going to be a good time for first-time buyers.”
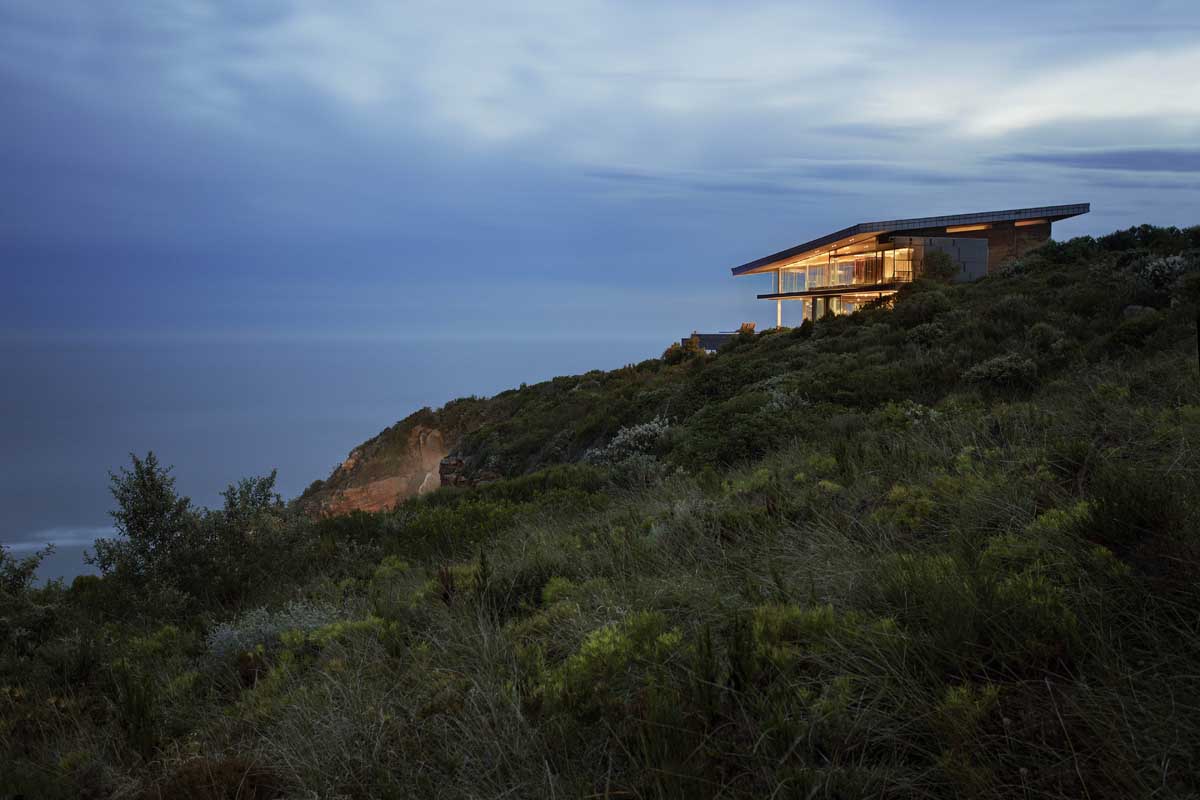
Stefan Antoni Olmesdahl Truen Architects and Antoni Associates have designed a home for a family in Knysna, South Africa. “The brief was to create a home for a Johannesburg based family that could eventually be used as a family home but would initially be used for holidays. The site enjoys spectacular views and it was important that the connection to these views was maximised,”
Advocates of looser lending standards may point to the NAR’s latest survey to highlight problems on the mortgage market. But it’s worth noting that the share of first-time buyers didn’t increase during the housing bubble, when it was too easy to get a mortgage. That’s because home prices were rising. The share of first-time buyers fell to 36% in 2006, at the peak of the bubble, from 40% in the prior three years.
And even though credit was much tighter in 2009 and 2010, the share of first time buyers jumped to 47% and 50%, respectively. Lower home prices helped. So, too, did an $8,000 federal tax credit for first-time buyers, which expired in June 2010.
Home prices have been rising for the last two years—and first-time buyers have accounted for a falling share of sales in that time.
Rising prices have fixed a number of ills ailing the housing market. They make consumers more willing to purchase homes or fix up the ones they live in. They make it easier for owners to sell if they get into trouble on their mortgage, limiting foreclosures.
But rising prices also make homes less affordable, especially for the marginal buyer, which in many cases is also the first-time buyer.
The NAR survey also found that people are staying in their homes longer than in the past. The median age of tenure–that is, the amount of time a typical homeowner stays in one house–rose to 10 years in the most recent survey, from six years in 2007.
The typical first-time buyer last year was 31 years old, while the typical repeat buyer was 53.
~~~~~~~~~~~~~~~~~~~~~~~~~~~~~~~~~~~~~~~~~~~
~~~~~~~~~~~~~~~~~~~~~~~~~~~~~~~~~~~~~~~~~~~
It’s not just the first-timers who are getting shut out – there are others too:
1. Those with average incomes.
2. Those with above-average incomes who are picky.
3. Self-employed and others who don’t have beefy tax returns.
4. Anybody with bad credit.
Yet the affordability has declined rapidly – from CAR:
CAR’s Housing Affordability Index – which tracks the percentage of households that can afford a median-priced, single-family detached home assuming current interest rates and 20% down – fell from 33% in the first quarter of 2014 to 30% in the second quarter, a 26% decline from a peak of 56% in early 2012.
While home buyers needed to earn an annual income of $56,320 to purchase the median-priced house two years ago, today they need an additional $37,270, or $93,590 total annually, to qualify.
The $93,590 annual income is needed to purchase the state’s median-priced home of $457,140. Around NSDCC, the current median price is over $1,000,000!
Comparing the first nine months of 2014 to the frenzied first nine months of 2013, the NSDCC detached-home sales have dropped 15% this year – which is still pretty strong if you ask me. We live in an affluent area!
By this time next year we should know if we have enough ready, willing – and able – buyers to keep prices at these levels or higher.