by Jim the Realtor | May 14, 2014 | Jim's Take on the Market, Sales and Price Check |
Dataquick’s April report was released yesterday, and it showed a now-modest 8.7% year-over-year increase in the San Diego County median sales price:

http://dqnews.com/Articles/2014/News/California/Southern-CA/RRSCA140513.aspx
An excerpt:
“The housing market’s pulse quickened a bit in April. If the inventory grows more, which we consider likely, it’s going to make it a lot easier for sales to reach at least an average level, which we haven’t seen in more than seven years. There are certainly factors undermining housing demand, including affordability constraints, credit challenges and less investment activity. But there are considerable forces fueling demand, too: Employment is rising, families are growing, and more people can qualify to buy again after losing a home to foreclosure or a short sale over the past eight years,” said Andrew LePage, a DataQuick analyst.
At least he mixed in a few of the positives with the typical negative reasons.
The median price is easily skewed just by the lack of cheaper homes for sale. Today there are 2,551 homes listed for sale under the $435,000 median sales price, and 4,638 listed over $435,000. The average list price in San Diego County today is $1,018,616!
The April sales were a result of decisions made in January through March. When breaking down today’s numbers, sellers should be less optimistic. The number of homes not selling has risen 10% in the last month, and asking prices have stalled in the last five weeks:

http://www.deptofnumbers.com/asking-prices/california/san-diego/
Data released over the next few months should better reflect a flat pricing trend, at least in San Diego County – let’s just hope it isn’t a flat spin. The lazy reporting could catch people off guard – epsecially sellers who loiter into the summer months before sharpening their pencil.
by Jim the Realtor | May 13, 2014 | Local Flavor |


Firefighters did a great job today – no injuries, and no homes lost – only a mobile home burned:
by Jim the Realtor | May 13, 2014 | Auctions, Listing Agent Practices, Market Buzz |
 This guy may not change the world but at least we’ll have more conversation about home auctions – though realtors will have to embrace the concept first:
by Jim the Realtor | May 13, 2014 | Jim's Take on the Market, North County Coastal, Sales and Price Check
Let’s look closer at the individual neighborhoods, and see how sales and average-pricing-per-sf have changed for detached-home sales that occurred in the March 1st-to-April 30th period:
| Town or Area |
Zip Code |
2012 |
2013 |
2014 |
2YR % chg $/sf |
| Cardiff |
92007 |
13/$475 |
18/$523 |
7/$799 |
+68% |
| NW Carlsbad |
92008 |
44/$271 |
38/$359 |
34/$361 |
+33% |
| SE Carlsbad |
92009 |
96/$241 |
106/$267 |
79/$315 |
+31% |
| NE Carlsbad |
92010 |
17/$236 |
24/$275 |
19/$304 |
+29% |
| SW Carlsbad |
92011 |
52/$271 |
54/$328 |
40/$361 |
+33% |
| Carmel Vly |
92130 |
69/$318 |
115/$364 |
83/$407 |
+28% |
| Del Mar |
92014 |
25/$680 |
29/$677 |
39/$713 |
+5% |
| Encinitas |
92024 |
74/$371 |
85/$413 |
69/$528 |
+42% |
| La Jolla |
92037 |
66/$554 |
66/$645 |
50/$740 |
+34% |
| RSF |
67+91 |
37/$400 |
43/$452 |
39/$530 |
+33% |
| Solana Bch |
92075 |
17/$424 |
24/$578 |
12/$657 |
+55% |
| NSDCC |
All Above |
510/$361 |
602/$412 |
471/$481 |
+33% |
| Poway |
92064 |
92/$252 |
90/$286 |
89/$321 |
+27% |
| S. San Marcos |
92078 |
91/$197 |
90/$229 |
88/$260 |
+32% |
| PB/MB |
92109 |
20/$454 |
41/$543 |
43/$603 |
+33% |
| West RB |
92127 |
95/$253 |
97/$304 |
79/$310 |
+23% |
| East RB |
92128 |
76/$256 |
112/$292 |
87/$322 |
+26% |
| RP |
92129 |
78/$254 |
69/$291 |
62/$322 |
+27% |
| Scripps Rch |
92131 |
47/$261 |
51/$291 |
54/$311 |
+19% |
A steady march upward – virtually every area has seen their average pricing rise 1% to 2% per month for two years solid.
We are back where we started – my first blog post from September 24, 2005: https://www.bubbleinfo.com/2005/09/24/20-25-appreciation-per-year-how-can-that-happen/
by Jim the Realtor | May 12, 2014 | Bubbleinfo TV, Cardiff

(photo taken down the hill on San Elijo Ave.)
There are 28 detached homes for sale in 92007 – 12 are more expensive:
by Jim the Realtor | May 12, 2014 | Sales and Price Check |
Yunnie says it’s ‘unhealthy’, but sellers would disagree. From MND:
http://www.mortgagenewsdaily.com/05122014_nar_metro_home_sales.asp
Lawrence Yun, NAR chief economist, said the price trend is favorable. “The cooling rate of price growth is needed to preserve favorable housing affordability conditions in the future, but we still need more new-home construction to fully alleviate the inventory shortages in much of the country,” he said. “Limited inventory is creating unsustainable and unhealthy price growth in some large markets, notably on the West Coast.”
 The five most expensive housing markets in the first quarter were the San Jose metro area, where the median existing single-family price was $808,000; San Francisco, $679,800; Honolulu, $672,300; Anaheim-Santa Ana, $669,800; and San Diego, where the median price was $483,000.
by Jim the Realtor | May 12, 2014 | Inventory
We are in the prime selling season, so it’s no surprise that inventory has grown since the beginning of the year.
But look at the average pricing. The Under-$800,000 list pricing has creeped up 4%, but the higher-priced categories are going in the other direction.
Since January 1st, the Over-$2,400,000 market has seen the inventory grow by 36%, and the average LP-per-sf drop 10% – and those are the unsold homes. They aren’t done yet!
The median asking prices don’t show the same change, probably because the lower-priced supply in each category is what’s selling. The remaining OPT leftovers keep the median asking prices rising, and new sellers want to price with the actives, not the solds, compounding the situation.

North SD County’s Coastal Region (La Jolla-to-Carlsbad)
The UNDER-$800,000 Market:
| Date |
NSDCC Active Listings |
Avg. LP/sf |
DOM |
Avg SF |
| November 25 |
95 |
$376/sf |
47 |
1,988sf |
| December 2 |
79 |
$371/sf |
50 |
2,047sf |
| December 9 |
72 |
$383/sf |
43 |
1,954sf |
| December 16 |
81 |
$378/sf |
42 |
1,948sf |
| December 23 |
77 |
$374/sf |
49 |
1,937sf |
| December 30 |
76 |
$373/sf |
51 |
1,950sf |
| January 6 |
74 |
$370/sf |
49 |
1,995sf |
| January 13 |
71 |
$381/sf |
44 |
1,921sf |
| January 20 |
72 |
$384/sf |
41 |
1,877sf |
| January 27 |
75 |
$399/sf |
40 |
1,891sf |
| February 3 |
78 |
$409/sf |
41 |
1,876sf |
| February 10 |
82 |
$395/sf |
38 |
1,927sf |
| February 17 |
85 |
$387/sf |
35 |
1,929sf |
| February 24 |
90 |
$383/sf |
37 |
2,008sf |
| March 3 |
82 |
$397/sf |
39 |
1,942sf |
| March 10 |
88 |
$377/sf |
37 |
2,008sf |
| March 17 |
89 |
$366/sf |
34 |
2,038sf |
| March 24 |
79 |
$369/sf |
34 |
2,031sf |
| March 31 |
78 |
$367/sf |
39 |
2,069sf |
| April 7 |
87 |
$373/sf |
32 |
2,054sf |
| April 14 |
97 |
$380/sf |
31 |
2,000sf |
| April 21 |
87 |
$377/sf |
32 |
2,062sf |
| April 28 |
107 |
$379/sf |
29 |
2,044sf |
| May 5 |
114 |
$376/sf |
27 |
2,046sf |
| May 12 |
108 |
$385/sf |
31 |
2,012sf |
The $800,000 – $1,400,000 Market:
| Date |
NSDCC Active Listings |
Avg. LP/sf |
DOM |
Avg SF |
| November 25 |
245 |
$448/sf |
61 |
2,856sf |
| December 2 |
239 |
$448/sf |
64 |
2,851sf |
| December 9 |
226 |
$461/sf |
65 |
2,812sf |
| December 16 |
211 |
$464/sf |
66 |
2,794sf |
| December 23 |
197 |
$453/sf |
73 |
2,813sf |
| December 30 |
173 |
$450/sf |
78 |
2,821sf |
| January 6 |
170 |
$470/sf |
65 |
2,757sf |
| January 13 |
168 |
$463/sf |
59 |
2,764sf |
| January 20 |
174 |
$444/sf |
51 |
2,882sf |
| January 27 |
166 |
$435/sf |
52 |
2,902sf |
| February 3 |
165 |
$441/sf |
53 |
2,857sf |
| February 10 |
175 |
$443/sf |
51 |
2,852sf |
| February 17 |
180 |
$447/sf |
50 |
2,803sf |
| February 24 |
188 |
$438/sf |
44 |
2,846sf |
| March 3 |
202 |
$421/sf |
44 |
2,936sf |
| March 10 |
215 |
$431/sf |
41 |
2,854sf |
| March 17 |
223 |
$421/sf |
42 |
2,918sf |
| March 24 |
217 |
$419/sf |
42 |
2,941sf |
| March 31 |
223 |
$425/sf |
44 |
2,887sf |
| April 7 |
224 |
$428/sf |
44 |
2,881sf |
| April 14 |
233 |
$429/sf |
44 |
2,892sf |
| April 21 |
237 |
$432/sf |
44 |
2,894sf |
| April 28 |
240 |
$430/sf |
45 |
2,848sf |
| May 5 |
272 |
$434/sf |
42 |
2,838sf |
| May 12 |
269 |
$438/sf |
42 |
2,831sf |
(more…)
by Jim the Realtor | May 10, 2014 | Interesting Houses
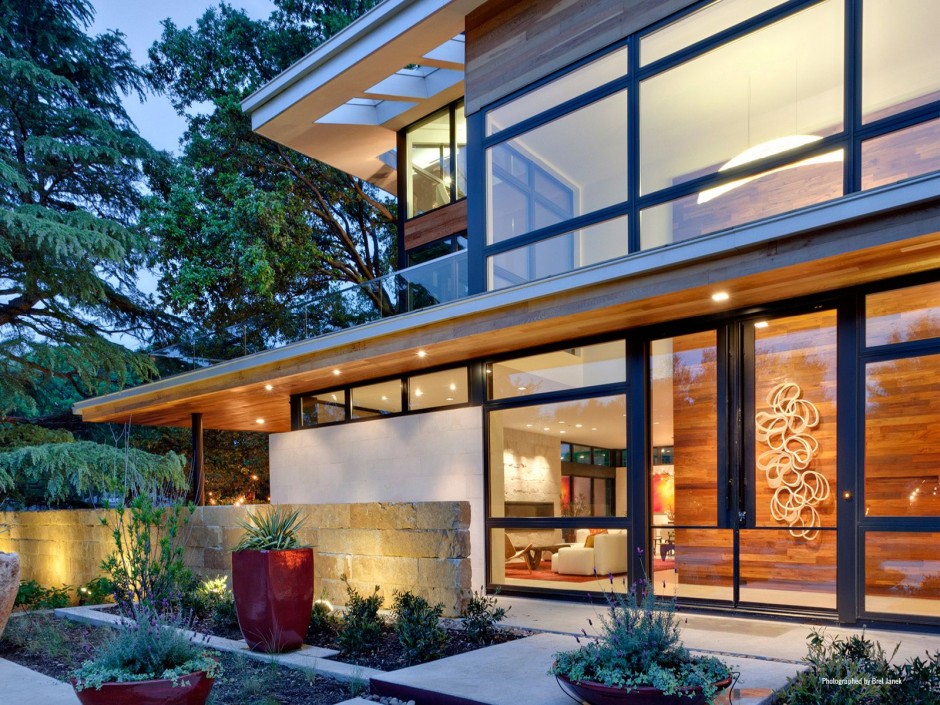
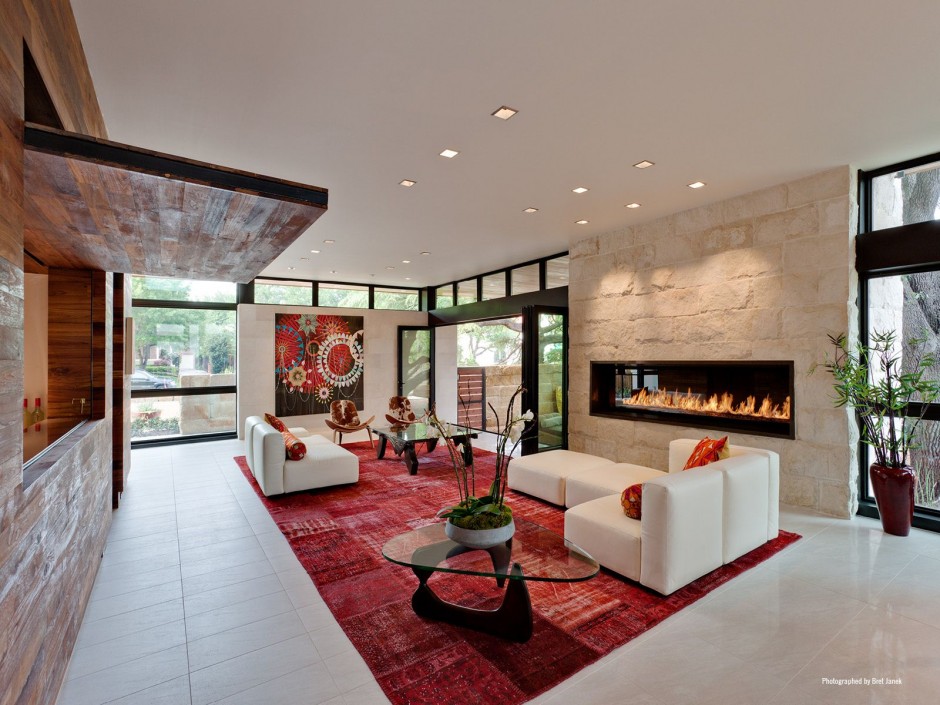
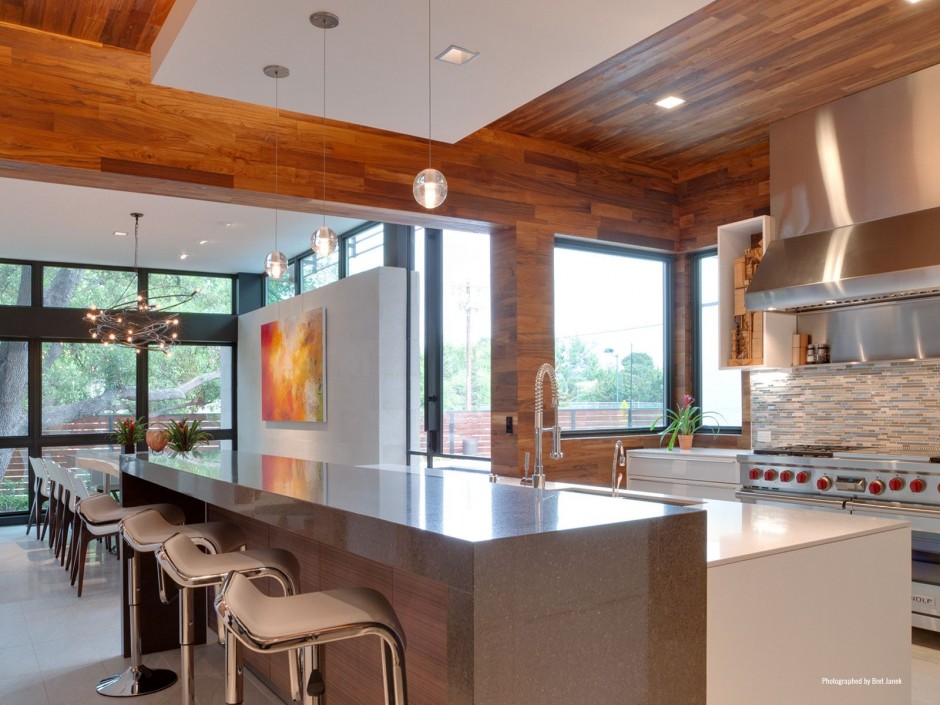
Architect Tom Reisenbichler designed this residence in Dallas.


http://www.contemporist.com/2014/01/27/the-caruth-boulevard-residence-by-tom-reisenbichler/
by Jim the Realtor | May 9, 2014 | Bubbleinfo TV, Cardiff, Drone, Solana Beach, View

There were two of us flying drones at the same time:
by Jim the Realtor | May 9, 2014 | Jim's Take on the Market, Thinking of Selling?, Why You Should List With Jim
Yesterday I was saying how we should be running into a glutty market by the end of summer – unless sellers are willing to adjust their prices in time.
Here is the recent history of list and sold pricing for San Diego County houses:

You can see how the trends were rising quickly during the frenzy era – but for almost a year now, the solds have been in a fairly tight range. Yet the list pricing is starting to take off again.
Evidence has never stopped sellers from dreaming though. In this latest survey, 40% say they will price their home above market value this quarter:
http://www.cnbc.com/id/101656130
An excerpt:
“I even hear them say that prices are skyrocketing,” said Jeremy Cunningham, a northern Virginia real estate agent with Redfin, a real estate brokerage. “When you ask them what their data source is or where they’re getting their information, it’s more of a vibe.”
Forty percent of sellers surveyed by Redfin said they are planning on pricing their homes above market value when they list in the second quarter of this year; that’s up from 33 percent at the beginning of the year. Redfin polled 1,128 active home sellers across 25 U.S. cities.
Confidence is behind it all. Fifty-two percent said they were confident that now is a good time to sell, versus just 37.5 percent three months ago.
We already saw how April was a bad month around here for average sold pricing, yet sellers keep pushing higher:
| NSDCC |
LP Avg $/sf |
SP Avg $/sf |
% diff |
| Jan 2014 |
$526/sf |
$501/sf |
5% |
| Apr 2014 |
$546/sf |
$449/sf |
22% |
When there is more than a 20% gap between LP and SP averages, a glut of over-priced homes is soon to follow – unless the April dip in pricing was an anomaly.
Are you are thinking about selling your home? Contact me today at jim@jimklinge.com or (858) 997-3801.


