These Palo Alto guys have been making national headlines since they rolled out their reduced-commission program last week. They are offering a $10,000 fee to buyer-agents, instead of a percentage, AND encouraging buyers to come directly to the listing agent to avoid paying any fees (which is my beef).
Why would a high-end independent brokerage that sold 100 homes in the last 12 months – mostly in the $3,000,000 to $10,000,000 range (with sales of $40,000,000 and $44,000,000 too) – feel the need to effectively shut out their fellow real estate agents? Beats me.
Last week, the Department of Justice stated that commissions should be decoupled and NO fee be offered up front to buyer-agents by the seller or listing agent (though they did agree that buyer-agents can include a seller-paid commission in their buyer’s offer).
What gets lost in the discussion is the 120-year history of broker cooperation – where other agents can sell my listings, and I can sell theirs. It is a terrific system that best serves the sellers and buyers, which is our fiduciary duty.
But greed and market-share dominance is pushing fiduciary duty to the sidelines. Instead, brokerages are taking advantage of the current uncertainty to craft a quasi-single-agency package that effectively shuts out the cooperating buyer-agents under the guise of saving the seller money. Is it in the seller’s best interest to discourage the outside buyer-agents?
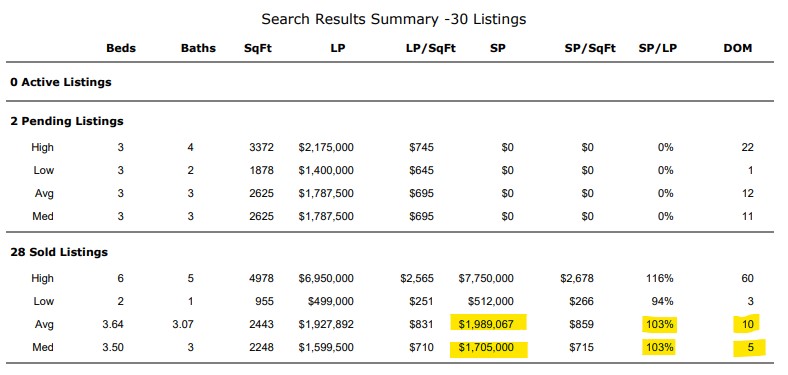
This is one of their first listings to hit the open market that offered their $10,000 fee to buyer-agents, and it went pending in seven days:
Agents will give you all sorts of mumbo-jumbo on why you should hire them, with the most favorite being that they are the “Local Expert”. Agents were local tour-guides before the internet – back when buyers would roll into town and plunk down their $72,500 for a house without knowing too much. But America was more innocent then.
Today, what matters more than anything is whether an agent can get people to the finish line.
If you have a particular agent in mind, all you have to do is input their name here:
Zillow will give you the sales history for any agent in America who has a webpage with them! Draw your own conclusions, but just seeing how many sales they have closed in the last 12 months is a good start.
Every agent can pull data from the MLS too.
It took me a minute to produce and share our listing history from the last 24 months with a seller:
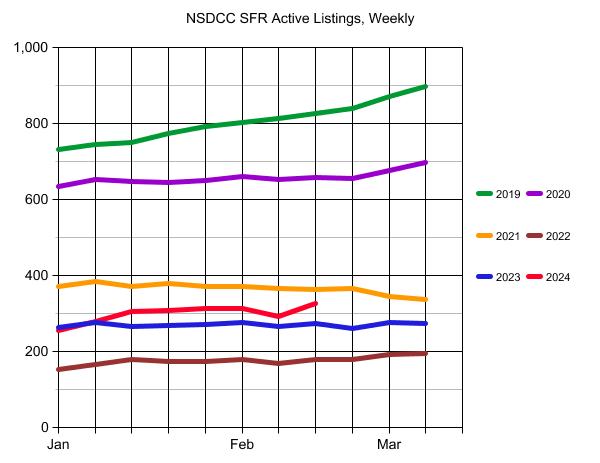
The blip in active listings over the last week isn’t too concerning and could just be from the weather.
The count of active listings is a good indicator of the demand though. During the mega-frenzy conditions from late-2020 through early-2022, you can see that the new listings were being gobbled up as quickly as they came on the market, and there was no build-up of the supply. Last year, the demand was hot enough in the early months that the active-listing counts were fairly flat too.
If this year’s count of active listings surges above 400, it will mean that we are exiting the frenzy days, and the market’s normalization is underway.
It is subject to the overall number of listings, and I’ll reuse yesterday’s chart to show the flow:
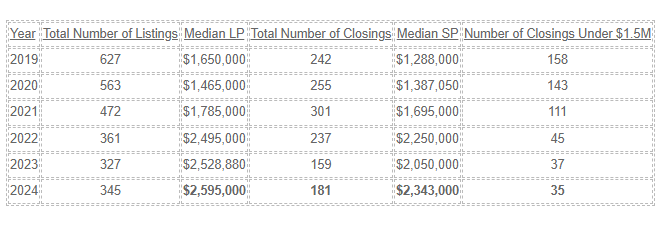
NSDCC Listings and Sales, Jan 1 – Feb 15
The total number of listings in 2024 is still in the frenzy range.
It’s the number of active listings that help demonstrate the velocity of the demand. Are they being gobbled up as fast as they hit the market like in recent years, leaving the number of actives fairly steady? Or are the actives starting to pile up, like they used to do? (see the 2019 green line in graph at top)
This is how we will know where the Spring Selling Season is going.
Buyers already have reason to be cautious and wait patiently because Powell opened his big yap and said he was going to lower his rate THREE times in 2024.
If the active listings break out of the frenzy range and start stacking up unsold, it will be irresistible for buyers to wait longer to see if sellers capitulate on price, while hoping rates might come down too.
Want to know where the market is going? Just watch the number/trend of the active listings!
There has been a lot of chatter lately about moving the train tracks but no decision has been made yet. Here’s how it looked four years ago – haven’t they fortified this by now? I think so:
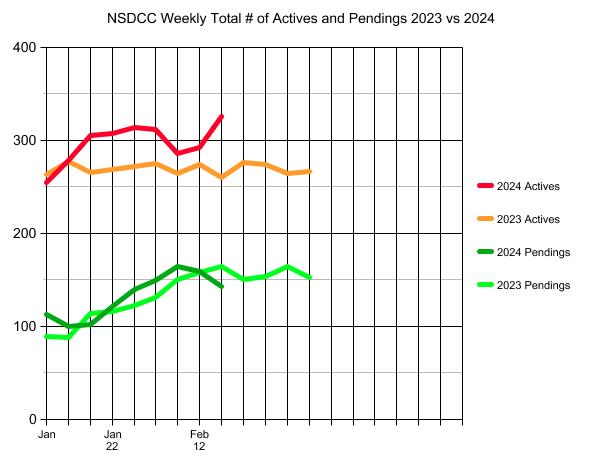
In the last week, the number of NSDCC active listings shot up by 12%, and the number of pendings dropped 10%, which at first glance looked like a bunch of escrows blew up.
But it was more due to the number of closings. There were 35 escrows that closed last week, bringing the February total up to 83 already. Last February there were only 112 closings, which we should easily beat.
NSDCC sales are 14% higher than last year, and we’ll have a few more late-reporters to add this year:
NSDCC Listings and Sales Between Jan 1 – Feb 15
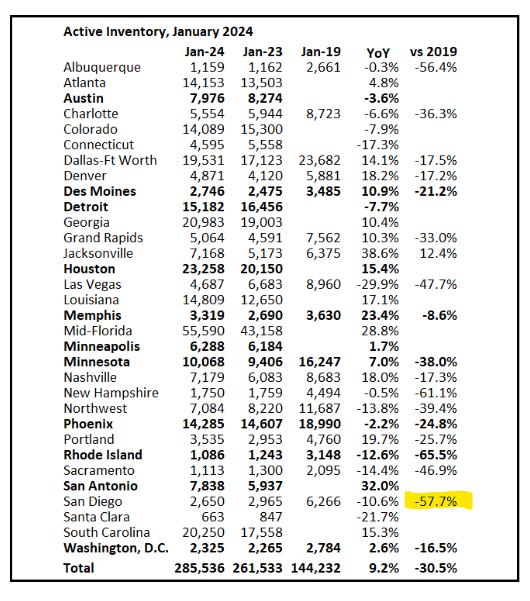
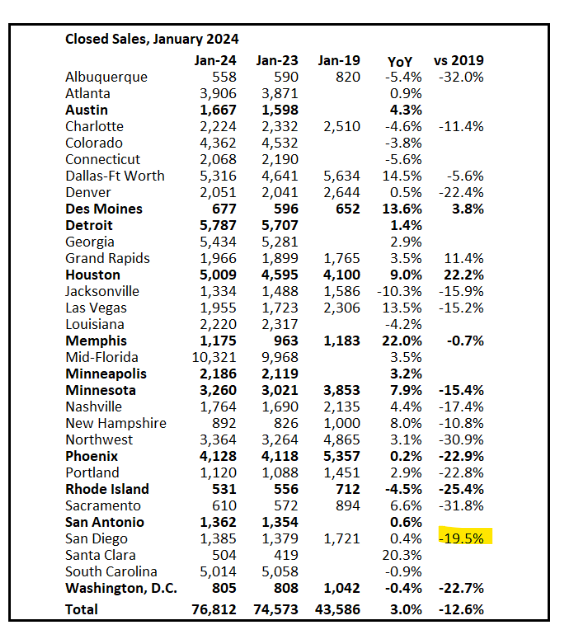
Here are Bill’s latest graphs. It’s incredible to see the comparison to 2019 – the active inventory was down 57.7% but sales were only off -19.5%:
Isn’t it interesting how some people know what dogs think and feel? Or are they just selling something?
“It’s always a good idea to give your dogs a dedicated bed or other comfortable perch that’s a spot only for them—it will make them feel so adored. There are so many fabulous ones on the market, and you can have fun with them by covering them in a fabric that matches the room or doing a pop of color that stands out.
“You can also place an upholstered ottoman at the foot of your bed which is a great way to keep your pup pampered without having to share your bed. Add in a throw to make it that much cozier and more comfortable. And if your dog has a chaise or chair they love in your home, give into it, and let that be theirs. Just cover it in a durable fabric or even slipcover it so that it’s easier to clean.”
Trustindex verifies that the original source of the review is Google.
We sold a home with Jim and Donna and from beginning to end they were consummate professionals. Their initial walk through the property resulted in a list of items to be repaired or updated. They supplied a list of vendors and job quotes to do the repairs and updates. We originally wanted to sell ‘as is’ and just get it over with. They gave us a selling price for ‘as is’ and options for doing a few updates/repairs to doing it all with the selling price for each option. We agreed to do all they suggested and we sold for the exact price they predicted. For every dollar spent we got back more than $2 back in the selling price. And they got that price in a rising interest rate environment! Donna and Jim are extremely detailed and guide you through ever aspect of the sale. There were no surprises thanks to their guidance. We couldn’t be more pleased with their representation.
Thank you Donna and Jim,
Jerry and Mary
Heather Quejada
March 27, 2025
Trustindex verifies that the original source of the review is Google.
We have known Jim & Donna Klinge for over a dozen years, having met them in Carlsbad where our children went to the same school. As long time North County residents, it was a no- brainer for us to have the Klinges be our eyes and ears for San Diego real estate in general and North County in particular. As my military career caused our family to move all over the country and overseas to Asia, Europe and the Pacific, we trusted Jim and Donna to help keep our house in Carlsbad rented with reliable and respectful tenants for over 10 years.
Naturally, when the time came to sell our beloved Carlsbad home to pursue a rural lifestyle in retirement out of California, we could think of no better team to represent us than Jim and Donna. They immediately went to work to update our house built in 2004 to current-day standards and trends — in 2 short months they transformed it into a literal modern-day masterpiece. We trusted their judgement implicitly and followed 100% of their recommended changes. When our house finally came on the market, there was a blizzard of serious interest, we had multiple offers by the third day and it sold in just 5 days after a frenzied bidding war for 20% above our asking price! The investment we made in upgrades recommended by Jim and Donna yielded a 4-fold return, in the process setting a new high water mark for a house sold in our community.
In our view, there are no better real estate professionals in all of San Diego than Jim and Donna Klinge. Buying or selling, you must run and beg Jim and Donna Klinge to represent you! Our family will never forget Jim, Donna, and their whole team at Compass — we are forever grateful to them.
Lou F
March 27, 2025
Trustindex verifies that the original source of the review is Google.
WeI had the pleasure of working with Klinge Realty Group to sell our home in Carmel Valley, and I cannot recommend them highly enough!
Jim and Donna demonstrated exceptional professionalism, offering expert guidance on market conditions and pricing strategy, which resulted in a quick and successful sale.
Communication was prompt and we were well-informed throughout the entire process.
For anyone looking for a dedicated and knowledgeable real estate team, look no further!
---
William Sams
March 25, 2025
Trustindex verifies that the original source of the review is Google.
Donna and Jim Klinge of Klinge Realty Group have our highest possible recommendation. From Donna and Jim’s first visit to our house through closing their advice and counsel was candid and honest in all dealings. They kept us fully informed throughout the process. The house sold less than three days after listing with a two-week closing. My wife and I have sold several houses during our lives. This was by far the best experience. Klinge Reality is a premium service realtor. You can’t make a better choice for someone to sell your home fast and for top dollar.
Emily Hernandez
December 29, 2024
Trustindex verifies that the original source of the review is Google.
Donna and Jim provided exceptional support and professionalism throughout the entire process. We couldn't have been happier with their efforts. They made our house shine, and thanks to their expertise, it sold above the listing price in the very first weekend! Truly a fantastic experience from start to finish.
Jesus Adrian Sahagun
November 11, 2024
Trustindex verifies that the original source of the review is Google.
This year has been difficult on our family, mainly due to having to sell our home. Thankfully we knew God had a plan for us and working with the Klinge team was a key part of it. It was an obvious decision to work with them again after such an amazing experience when purchasing the same home we needed to sell. The challenge was, how will we do this in so little time with so much going on? Jim and Donna held our hand every step of the way. Whenever an unexpected issue arose they found and provided a solution. Never once did we feel pressured to make a decision and the Klinges were always reassuring after providing the information that the decision was ours to make. Despite the curve balls, they never panicked and exemplified the “can do” attitude, making us feel optimistic and taken care of. Their expertise and professionalism was superb. But of all the reasons to work with the Klinges, the most impactful and valuable is their compassion and genuine care for their clients. We pray that we can one day purchase our forever home and you better believe that Jim and Donna will be representing us - as long as they will have us of course. Thank you again Klinge team! Your execution, experience, and care are unmatched.
SABIHA PASHA
July 23, 2024
Trustindex verifies that the original source of the review is Google.
Jim and Donna were fantastic! Jim understanding my needs, recommending potential places, pointing out the pros and cons of each property was invaluable. Then when the offer was accepted Donna’s organized guidance through the inspections, paperwork etc made the whole process seem effortless.
So grateful that I had them on my side!
Anu Koberg
July 13, 2024
Trustindex verifies that the original source of the review is Google.
We first found Jim through his blog at bubbleinfo.com, which really showcased his knowledge of SoCal real estate. Since then we've done three transactions with Jim and Donna, and they are an incredible full service agency, with Jim's deep market insight and Donna's deft contract and project management. We trust them implicitly in their analysis and strategy, which is based on years of experience. They're always available and on top of things, and we strongly recommend them to anyone.
Bjorn Isachsen
July 10, 2024
Trustindex verifies that the original source of the review is Google.
The Good
The Klinge Realty Group operates like a finely tuned machine, with a very personal touch. We contacted them on a Sunday and they were talking to us about our family and our needs on our living room couch the following day. They carefully listened to us and worked with us to identify the best and quickest path to listing within 2 weeks to take advantage of the low inventory conditions in our South Carlsbad neighborhood. They knew our tract specifically and had many previous sales there over the years - they came prepared with a thorough analysis of comparative sales and recommended a pricing strategy that they felt confident would yield offers the first weekend on the market.
The Great
Over the next two weeks Donna coordinated a range of vendors who she knew from experience could get the preparation to list work we needed done on time and with high quality. Our light tune-up involved excellent experiences with their stagers, landscapers, contractors, electricians, and plumbers. Throughout this period Donna's daily communication was clear, concise, and responsive. Any time we had questions Donna picked up the phone or texted immediately - but almost always, she answered our questions before we even knew we had them.
The Outstanding
We had a tricky situation with a shared fence that could have delayed our escrow. Donna used superb mediation skills to negotiate the terms of replacement and was personally on site with the fence contractor to make sure everything went smoothly. The fence looks great and escrow closed on time.
The Truly Exceptional
Our house came on the market on a Wednesday and between then and Monday morning Jim was personally at all three open houses. He was in constant communication explaining potential buyer reaction and strength. As he predicted offers began to come in on Saturday and each one was incrementally higher than the last. At the end we had 5 offers, 4 of which were over list, and the final accepted offer was $100,000 over list. In addition to being over list it included rent back terms that met our needs.
The Recommendation
For all of these reasons we would strongly recommend The Klinge Team to anyone wanting to sell in North County Coastal San Diego. I had been reading Jim's bubbleinfo.com blog for 15 years and knew when the time came to sell that he would be our first call. Jim Klinge is not your standard realtor. He is keenly aware of market conditions and sales strategies. And, works his tail off - though not as hard as Donna . At this point he's gone from realtor to friend and I plan to have him over to grill and chill at our new place to talk real estate, but also just about life and raising kids in San Diego. He's more interested in relationships than his sales numbers - and that's why his sales numbers are so high. We have already recommended the Klinge's to some close friends and another successful sale is on deck right around the corner...
Chris Shea
June 21, 2024
Trustindex verifies that the original source of the review is Google.
We recently had the pleasure of working with Jim and Donna from Klinge Realty Group to sell our house, and we couldn't be more satisfied with the experience. From the initial meeting, they listened attentively to our needs and provided invaluable guidance on specific improvements to get our home market ready.
Their responsiveness throughout the entire process was truly impressive. Anytime we had questions or concerns, they were quick to address them, ensuring we felt comfortable and informed every step of the way. What stood out the most was their team and extensive network of tradespeople, which made addressing any necessary repairs or updates seamless and stress-free.
Thanks to their expertise and dedication, our house sold quickly and at a great price. We highly recommend Jim and Donna to anyone looking to buy or sell a home. They are a fantastic team who truly care about their clients and deliver exceptional results.