A remarkable achievement considering that Compass has only been a nationwide company for 3-4 years.
It will matter more later too.
CoStar is going to change the search-portal landscape, and if they spend enough advertising money to get all the eyeballs, the buyer-agents will be cooked. Unlike Zillow and Redfin who encourage viewers to contact their own set of agents, CoStar will direct people back to the listing agent of each property.
You can imagine the advertising that could change everything:
“Would you rather be represented by a third-party who doesn’t know a thing about the house in question, or do you want to speak to the listing agent who knows everything about the property – including how to get you the best deal?”
CoStar got a head start when they boughthomes.com, and are rolling out their first version this summer in New York City.
Buyer-agents will be forced to join realtor teams who have the listings, or just fade away.
Who has Compass been recruiting for the last four years? That’s right, the realtor teams.
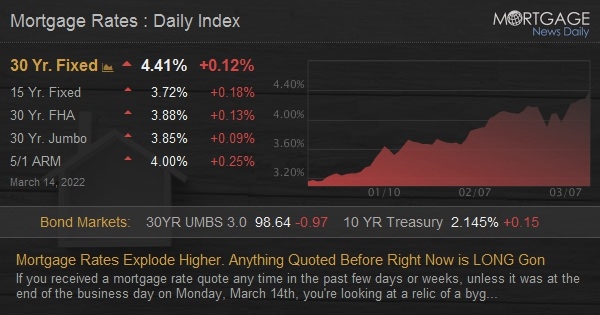
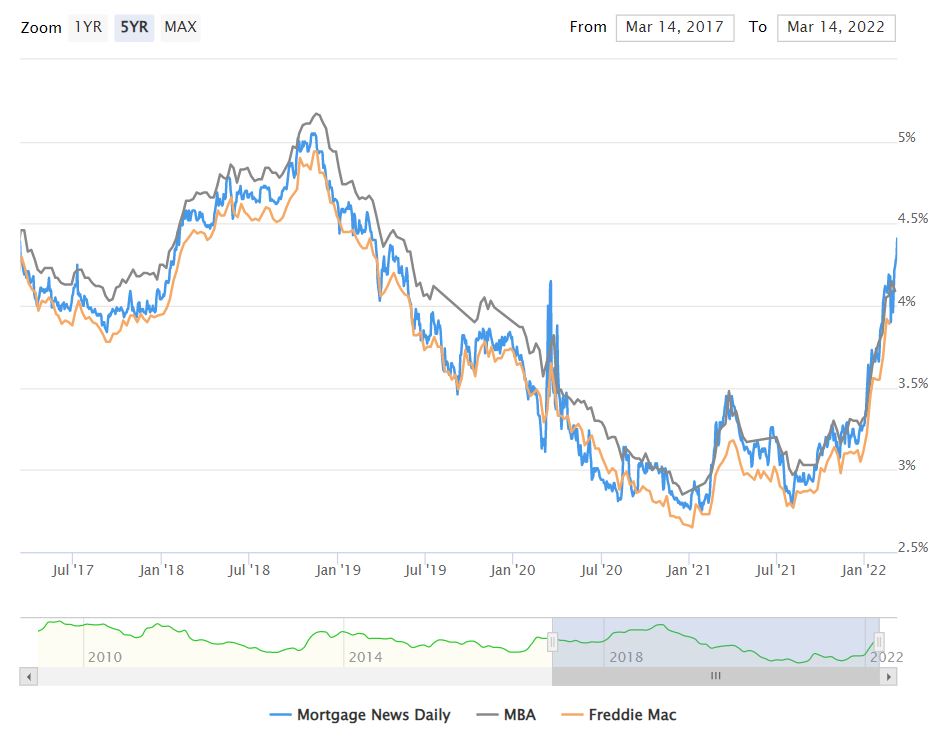
The Mortgage Bankers Association (MBA) released its latest mortgage application numbers this morning and the modest movement belies the drama unfolding in the world of mortgage rates. As usual, the MBA does a good job of capturing average rate movement week to week and they correctly identified last week’s big spike to the highest levels since the first half of 2019.
Despite the surge, mortgage applications didn’t respond in a major way. Refi applications only fell 3% from the previous week. Purchase applications actually managed a small uptick of 1% after last week’s more substantial 9% improvement. But context matters.
As seen in the following chart, refi applications have declined massively from Summertime highs and even more massively from the high levels at the beginning of 2021. MBA notes this week’s tally is 49% lower than the same week last year. The news is less dire on the purchase side. Applications are still lower than most of the past few months, but higher than most of the late summertime months from 2021:
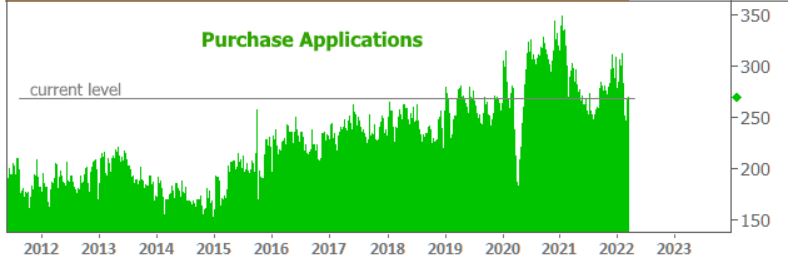
Speaking of context mattering, a longer term chart of the same data really helps put the magnitude of this most recent rate spike into perspective. It’s not an exaggeration to say it’s now the sharpest move higher that any of us have seen in more than a decade (the overall size is about the same as 2016-2018, but this one has happened in roughly 6 short months… not only that, but 2016-2018 was really a 2-parter).
The other takeaways from the chart include the notion that the purchase market is still firing on all cylinders relative to most of the past decade (even then, we can responsibly conclude it would be even higher if not for the low inventory situation) and that refi demand doesn’t have much farther to fall before hitting the historical bottom. In fact, due to the immense equity build-up of the past 2 years, the doldrums of 2017-2018 may not be a relevant baseline this time around.
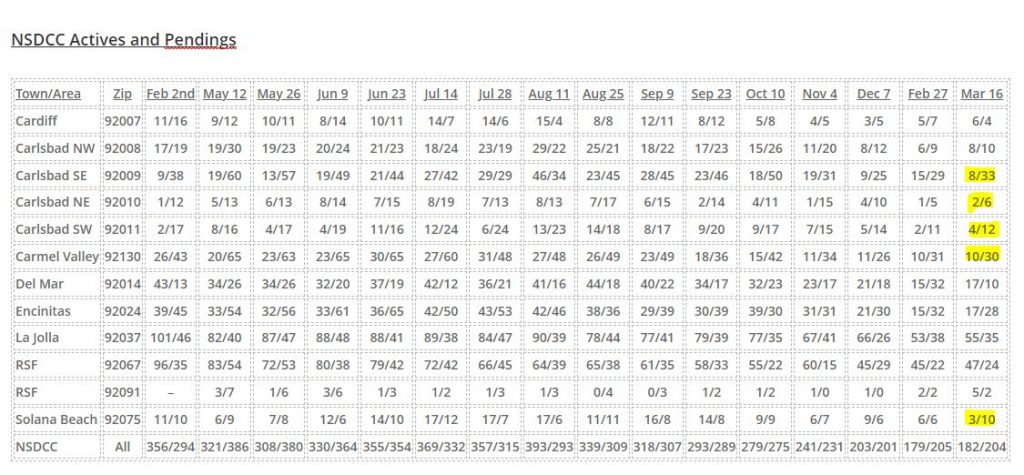
Let’s see which areas are picking up steam early in the selling season:
We used to think that a normal and healthy market has a ratio of 2:1 actives to pendings, so it’s stunning to see five areas that have 3x the number of pendings as actives! And SE Carlsbad has more than 4x!
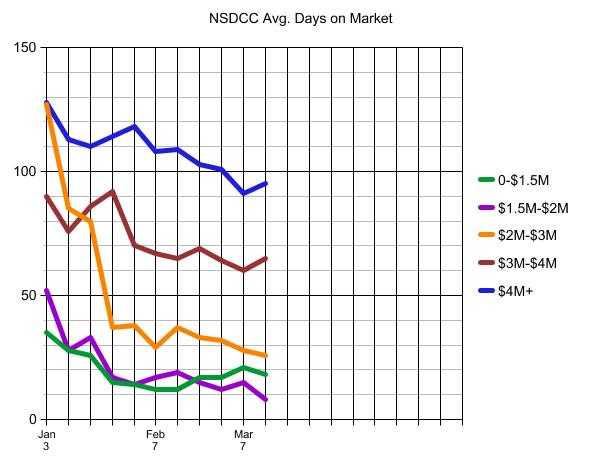
The trend of the average days-on-market can give us a feel for the market direction too:
In 2020, we had 400+ pendings from June 22nd to November 30th – with a peak of 491 pendings on September 7, 2020.
Last year, the high pending count was 386 on May 12th – and this year’s peak will likely be in May too.
It looks like I made an error on the Del Mar A/P counts in the last reading.
I spoke with Jordan at the San Diego County Tax Assessor’s office about their Prop 19 processing. He said they have received about 1,000 requests since Prop 19 went into effect last April 1st, and have completed about half of them. He said there is a backlog of 6-9 months because they are appraising/analyzing every property in question to ensure compliance.
There were 36,936 sales of attached and detached homes in San Diego County since April 1, 2021, so the 1,000 requests (3%) gives us a feel for how effective Prop 19 has been in getting seniors to move (not very).
From Liam at the LAT:
Rose Liebermann opened her property tax bill and did a double take.
The $15,584 she owes on her new West Hills home was almost four times as much as the taxes on her previous house in Granada Hills where she had lived for more than 30 years.
“This bill, when I saw it, I said, ‘This can’t be real,’ ” said Liebermann, 71, a clinical social worker.
It wasn’t supposed to be that way. Proposition 19, narrowly approved by California voters in 2020, gives older homeowners a property tax break when they move. Specifically, it allows those 55 and older to blend the taxable value of their previous home with the value of a new, more expensive home they purchase, resulting in significant tax savings.
But processing delays at the Los Angeles County assessor’s office have left property owners like Liebermann facing hefty tax bills that must be paid while they wait for their applications to be approved.
Nearly a year after the law took effect, the assessor’s office has not completed any of the 1,271 applications it has received to recalculate the property taxes for older and disabled homeowners under the law, according to the agency. And it hasn’t finished any of the nearly 3,700 applications for parent-to-child and grandparent-to-grandchild inheritances, the other major piece of the tax measure.
Liebermann moved last summer because she wanted to help her daughter, Natasha Gershon, who is divorced and raising two young children, including a 10-year-old son with autism. Believing the tax measure would make it possible for her to afford a nicer place, Liebermann decided to buy the larger single-family home in West Hills where they all could live.
Liebermann has since borrowed money through a refinance loan to help pay the property tax and to build an accessory dwelling unit for herself.
Currently, the entry level for Carlsbad houses is around $1,200,000, so when this one first hit the market at $1,119,000 you can bet it stirred up the frenzy!
They raised the list price to $1,199,000, but it didn’t slow anyone down. The agent received 28 offers, and they countered the best five. It closed for $1,525,000!
We gave credit to the ultra-low rates when they were in the 2%-range for helping to create the frenzy. Likewise, higher rates will have something to do with the way the market turns out in 2022.
It’s not because the payment are so much different. When the rate changes from 3.0% to 3.85% on a $1,000,000 loan, the payment only changes $472 per month.
The change will be because of the effect that higher rates have on market psychology.
We’re not going to get a memo on the day when buyers decide that they have had enough.
We know what signs to look for – higher market times, declining SP:LP ratios, and a growing amount of active (unsold) listings – to recognize when the market conditions are adjusting, and it’s been quiet so far.
Harder to measure is how quickly the demand could subside.
With the quality homes fetching an average of five offers each (roughly), then for every sale there is probably 2-3 losers that are literally priced out or voluntarily quit the race. At that rate, the demand could be cut in half or less within a couple of months.
Add the war in the Ukraine, rates well into the 4s, and list prices starting at 10% above the comps, and you have all the ingredients needed for a slowdown. Because the market is so hyped up, there will be ample overshoot and the frenzy should last into summer. But everyone knows it won’t last forever.
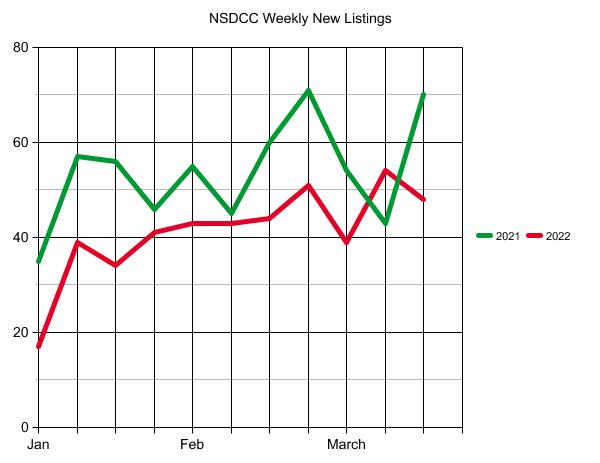
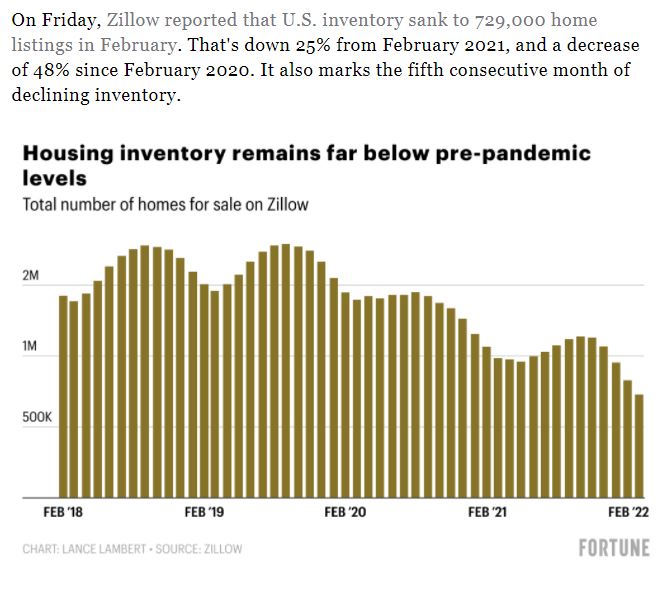
Bill is reporting a 3.1% increase in inventory nationally, which sounds hopeful and we can only pray that it happens here. But we were really far behind after the holidays and we’re still struggling to catch up:
NSDCC Inventory:
March 15, 2021 – 332 Actives, 333 Pendings
March 14, 2022 – 195 Actives, 196 Pendings
The number of houses for sale between La Jolla and Carlsbad is 41% lower than last year!
There wasn’t an obvious winner at the TinyFest – everyone is asking full retail for their product, and it makes you think that going custom is a better choice. And they all do custom!
Some homes are selling for less than their list price!
The original list price was $4,925,000 and this just closed for $4,226,625 for 6 br/6.5 ba, 6,031sf on a 37,026sf lot. Buyer had a license so they discounted the price instead of taking the commission:
Trustindex verifies that the original source of the review is Google.
Jim & Donna Klinge helped us sell our home of 30 years in Ocean Hills. We were very happy with their service and would HIGHLY recommend them to anyone looking for an Honest, Knowledgeable, Skilled, Informed Efficient realty team. Both Jim & Donna were so helpful in different ways and complemented each others skills. Please refer to a more detailed review that we wrote on YELP. Thank You Both for all your help!!!
Jesse O'Hara
June 12, 2025
Trustindex verifies that the original source of the review is Google.
A+ thank you
Lisa Tuomi
June 11, 2025
Trustindex verifies that the original source of the review is Google.
Many years ago, we purchased a home in Carlsbad, using a realtor that was recommended to us - Jim Klinge. Fast forward to 2025, we recently had the privilege of selling 2 homes in Carlsbad, CA and didn't hesitate to reach out to Jim and Donna Klinge of Klinge Realty Group to guide us through the sales. The transactions were very different, each with its own unique situation, opportunities and challenges. From start to finish, Donna and Jim helped navigate the pre-sale preparation, the listing, showing of the house, buyer negotiations, the final close and all of the paperwork and decisions in between. What stands out with both transactions is the professionalism of Jim and Donna (and their team), wonderful communication (timely, relevant, concise), their deep understanding of market dynamics (setting realistic expectations), their access to top-notch contractors, and last, their ability to guide us across the finish line successfully. We wouldn't hesitate to use Jim and Donna in the future and highly recommend them for anyone looking to buy or sell a property in North San Diego County.
Jerry Meyer
March 28, 2025
Trustindex verifies that the original source of the review is Google.
We sold a home with Jim and Donna and from beginning to end they were consummate professionals. Their initial walk through the property resulted in a list of items to be repaired or updated. They supplied a list of vendors and job quotes to do the repairs and updates. We originally wanted to sell ‘as is’ and just get it over with. They gave us a selling price for ‘as is’ and options for doing a few updates/repairs to doing it all with the selling price for each option. We agreed to do all they suggested and we sold for the exact price they predicted. For every dollar spent we got back more than $2 back in the selling price. And they got that price in a rising interest rate environment! Donna and Jim are extremely detailed and guide you through ever aspect of the sale. There were no surprises thanks to their guidance. We couldn’t be more pleased with their representation.
Thank you Donna and Jim,
Jerry and Mary
Heather Quejada
March 27, 2025
Trustindex verifies that the original source of the review is Google.
We have known Jim & Donna Klinge for over a dozen years, having met them in Carlsbad where our children went to the same school. As long time North County residents, it was a no- brainer for us to have the Klinges be our eyes and ears for San Diego real estate in general and North County in particular. As my military career caused our family to move all over the country and overseas to Asia, Europe and the Pacific, we trusted Jim and Donna to help keep our house in Carlsbad rented with reliable and respectful tenants for over 10 years.
Naturally, when the time came to sell our beloved Carlsbad home to pursue a rural lifestyle in retirement out of California, we could think of no better team to represent us than Jim and Donna. They immediately went to work to update our house built in 2004 to current-day standards and trends — in 2 short months they transformed it into a literal modern-day masterpiece. We trusted their judgement implicitly and followed 100% of their recommended changes. When our house finally came on the market, there was a blizzard of serious interest, we had multiple offers by the third day and it sold in just 5 days after a frenzied bidding war for 20% above our asking price! The investment we made in upgrades recommended by Jim and Donna yielded a 4-fold return, in the process setting a new high water mark for a house sold in our community.
In our view, there are no better real estate professionals in all of San Diego than Jim and Donna Klinge. Buying or selling, you must run and beg Jim and Donna Klinge to represent you! Our family will never forget Jim, Donna, and their whole team at Compass — we are forever grateful to them.
Lou F
March 27, 2025
Trustindex verifies that the original source of the review is Google.
WeI had the pleasure of working with Klinge Realty Group to sell our home in Carmel Valley, and I cannot recommend them highly enough!
Jim and Donna demonstrated exceptional professionalism, offering expert guidance on market conditions and pricing strategy, which resulted in a quick and successful sale.
Communication was prompt and we were well-informed throughout the entire process.
For anyone looking for a dedicated and knowledgeable real estate team, look no further!
---
William Sams
March 25, 2025
Trustindex verifies that the original source of the review is Google.
Donna and Jim Klinge of Klinge Realty Group have our highest possible recommendation. From Donna and Jim’s first visit to our house through closing their advice and counsel was candid and honest in all dealings. They kept us fully informed throughout the process. The house sold less than three days after listing with a two-week closing. My wife and I have sold several houses during our lives. This was by far the best experience. Klinge Reality is a premium service realtor. You can’t make a better choice for someone to sell your home fast and for top dollar.
Emily Hernandez
December 29, 2024
Trustindex verifies that the original source of the review is Google.
Donna and Jim provided exceptional support and professionalism throughout the entire process. We couldn't have been happier with their efforts. They made our house shine, and thanks to their expertise, it sold above the listing price in the very first weekend! Truly a fantastic experience from start to finish.
Jesus Adrian Sahagun
November 11, 2024
Trustindex verifies that the original source of the review is Google.
This year has been difficult on our family, mainly due to having to sell our home. Thankfully we knew God had a plan for us and working with the Klinge team was a key part of it. It was an obvious decision to work with them again after such an amazing experience when purchasing the same home we needed to sell. The challenge was, how will we do this in so little time with so much going on? Jim and Donna held our hand every step of the way. Whenever an unexpected issue arose they found and provided a solution. Never once did we feel pressured to make a decision and the Klinges were always reassuring after providing the information that the decision was ours to make. Despite the curve balls, they never panicked and exemplified the “can do” attitude, making us feel optimistic and taken care of. Their expertise and professionalism was superb. But of all the reasons to work with the Klinges, the most impactful and valuable is their compassion and genuine care for their clients. We pray that we can one day purchase our forever home and you better believe that Jim and Donna will be representing us - as long as they will have us of course. Thank you again Klinge team! Your execution, experience, and care are unmatched.
SABIHA PASHA
July 23, 2024
Trustindex verifies that the original source of the review is Google.
Jim and Donna were fantastic! Jim understanding my needs, recommending potential places, pointing out the pros and cons of each property was invaluable. Then when the offer was accepted Donna’s organized guidance through the inspections, paperwork etc made the whole process seem effortless.
So grateful that I had them on my side!