

Let’s see which areas are picking up steam early in the selling season:
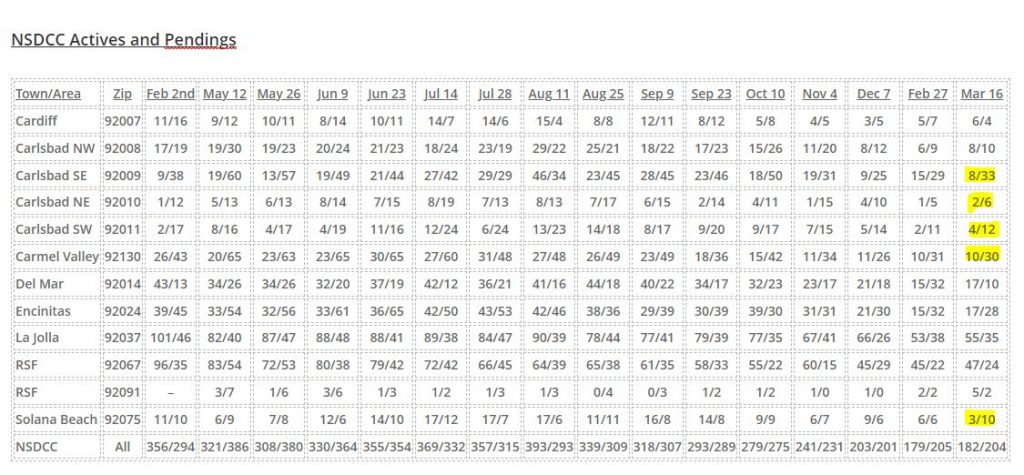
We used to think that a normal and healthy market has a ratio of 2:1 actives to pendings, so it’s stunning to see five areas that have 3x the number of pendings as actives! And SE Carlsbad has more than 4x!
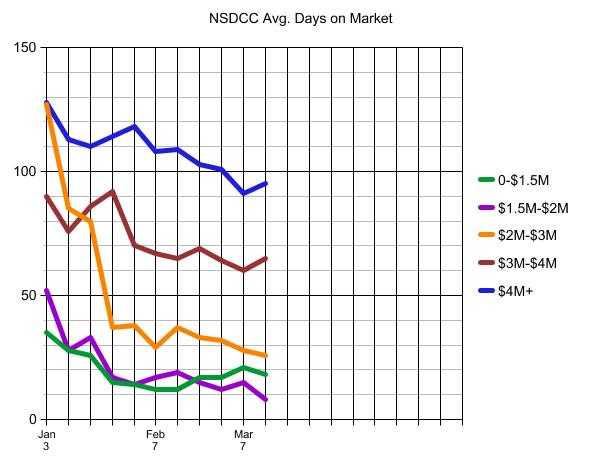
The trend of the average days-on-market can give us a feel for the market direction too:
In 2020, we had 400+ pendings from June 22nd to November 30th – with a peak of 491 pendings on September 7, 2020.
Last year, the high pending count was 386 on May 12th – and this year’s peak will likely be in May too.
It looks like I made an error on the Del Mar A/P counts in the last reading.


Hot Buy of the Day – agent said she had 82 showings yesterday – I’m hoping she meant 82 people, which would have been a ton. 82 showings? Wow!
https://www.compass.com/listing/29573-miller-road-valley-center-ca-92082/989881109293433721/