This 1998 tract house sold for $2,440,000, or +$144,000 over list price (+6%). The +6% should be about the maximum from now on. Heck, these are selling for the same money as they were getting next door in the Ranch of Carlsbad last summer!
This just hit the market and will be a good one to watch.
It’s the least-expensive house for sale west of I-5 in Solana Beach, and it’s in a quiet little stretch only a block from the beach access and walking distance to everything in downtown SB! Asking $2,395,000 – thanks to the Compass listing agent Wendy!
By the end of today, the 30-year mortgage rate should be in the mid-6s – who would buy a house now?
Between higher prices, higher rates, and the hefty federal and state capital-gains tax, the move-up/move-down homeowners are effectively locked in to their existing home. It’s just too hard to make sense of a move, unless there is another strong reason to overcome those.
It would help if they don’t mind leaving town, and probably leaving California. But who wants to do that?
Without the move up-and-downers, the supply and demand will both be greatly diminished, and the number of sales should drop significantly. But there will always be sales!
Here are the potential buyers who might still be interested, even at 6%-7%:
The Mega-Rich – When they see something they like, they just buy it.
Tenants – They are sick of how high the rents have become, and they don’t want to keep moving around trying to ease the pain. Some inheritance would help.
Inheritance/Gifts – They have been waiting, and now their ship has come in.
Job Transferees – They are used to owning, and they usually have their company’s blessing – and relocation package ($$) to assist them with the transition.
Contarians/Opportunists – The deal hunting will kick into high gear.
Self-Employed – Lenders should ease up a bit on underwriting to keep the doors open, and the alternative mortgage products might get more love. Qualifying with 24 months of bank statements, instead of tax returns, and getting a 8% or 9% rate won’t sound as onerous as it did when rates were 3%.
Most Everyone at a 10% to 20% discount – Those who stay in the hunt might get lucky!
Hopefully, the floor for NSDCC sales should be around 100 per month while the market recalibrates in preparation for the next selling season.
If sales drop below 100 per month, then I’ll be looking for the panic button!
Coming off the initial covid months, everyone thought the red-hot market was an acceptable reaction to the way our world had changed. But it’s gone too far, and somebody had to do something – and the Fed is going to do it again tomorrow, which will continue the rise in mortgage rates.
It means sales are going to tumble, which is nothing we can’t handle.
Here’s how it looks so far:
NSDCC June Sales
2017: 360
2018: 299
2019: 282
2020: 274
2021: 357
2022: 61
Currently there are 198 homes in escrow, and 68 of those were marked pending this month.
Of those that went pending prior to June 1st, let’s guess that 100 of them will close in June – and there might be a few others that are just coming together this week with a quick close date in June too.
It will make for around 180-200 NSDCC sales this month! It’s quite a bit lower than usual, but we’ll survive.
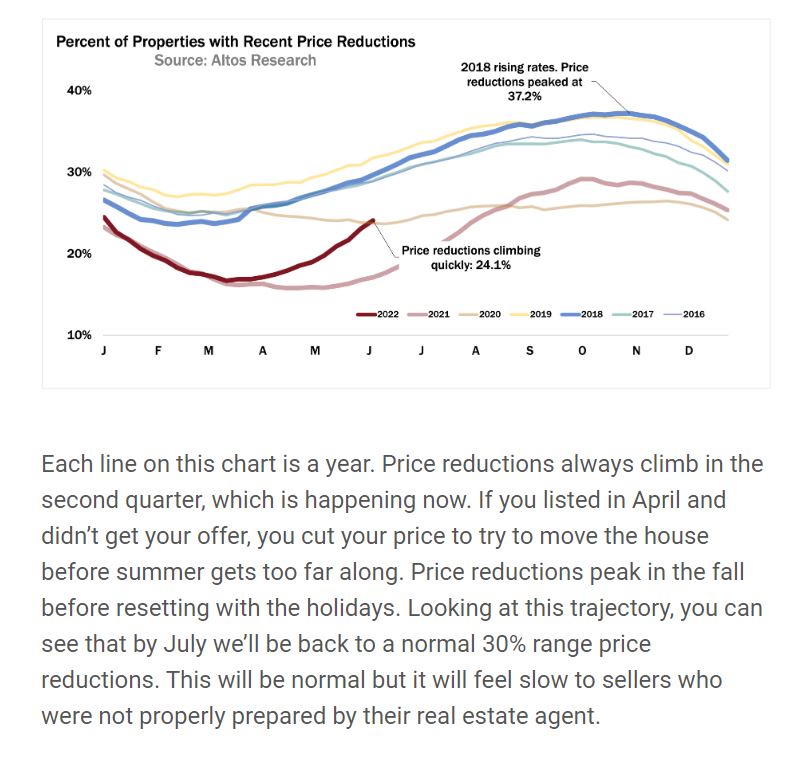
We’ll have more unsold listings, longer market times, price reductions, and fewer sales – it’s all part of the recalibration! Additional price reductions are an unreliable indicator because you don’t know how crazy the recent list prices were in the beginning, and they have never been so optimistic, even for the frenzy.
The closed-sales pricing will be the last thing to change, if at all.
I’m sticking with my +/- 5% for NSDCC pricing here in Plateau City.
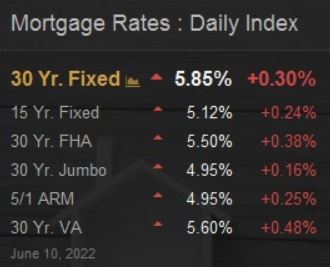
As you can see in my mortgage-rate tracker (in right column), we had another meltdown today, and the conforming rate now is over 6% (with no points).
The idea of paying higher prices AND rates really discourages the move-up/move-down markets. Combined those with having to pay federal and state capital-gains taxes and the existing homeowners aren’t going to give moving another thought. They probably weren’t giving it much thought any way! And now they might have to sell their home for less? Forgetaboutit!
While most will be (rightfully) concerned about how the buyer pool could dry up, also keep in mind that for every move-up/move-down homeowner that decides not to move, the supply side shrinks a little more too.
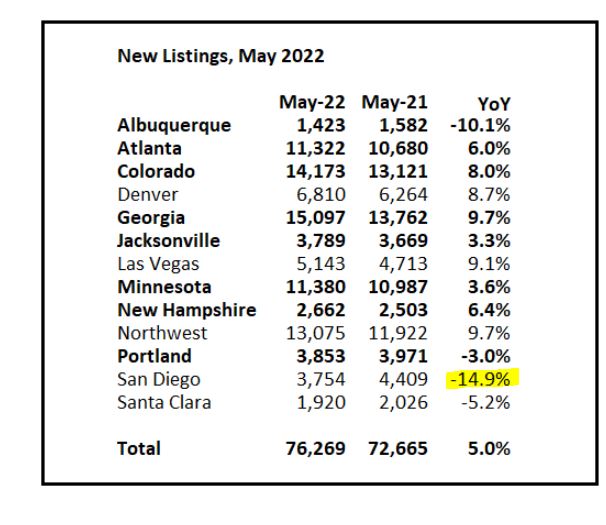
Bill added more towns to this list, and it keeps showing how San Diego is bucking the national trend:
We’ve had enough buyers who NEED a house that sales will keep happening, regardless of mortgage rates. I’m sure buyers are hoping to just pay the list price, or less, to compensate.
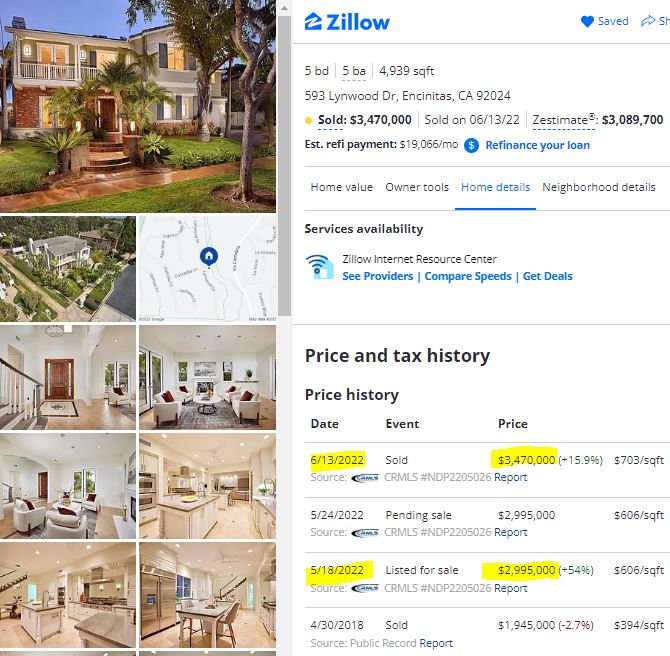
Yet, after rates got into the 5s and several ER sales closed for less, here’s another over-list:
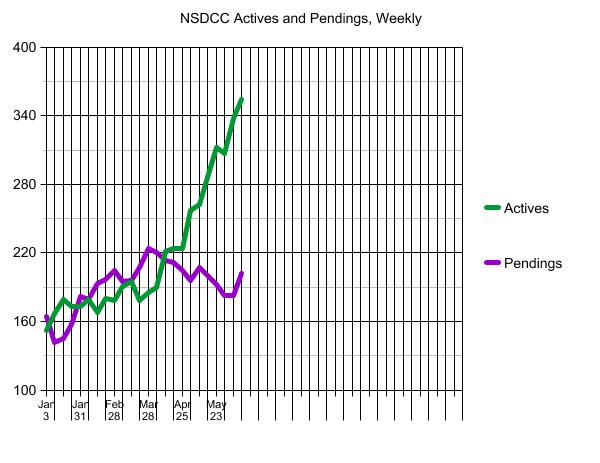
The number of active listings keeps climbing, which is expected. The likelihood of getting the list price wrong has probably never been higher, given that sellers have been planning their move for months – and they are going to test it out to see if they can get lucky, rather than adjust the price pre-maturely.
With more choices available, the buyers are reacting, and the number of pendings increased 10%.
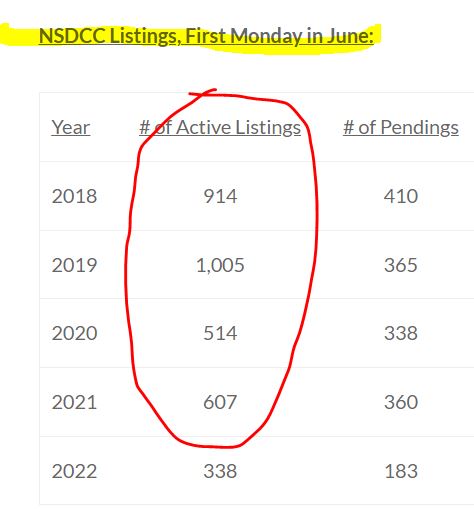
As a reminder from last week, we used to have 900-1,000 active listings at this time of year:
It will be irresistible for people to wait-and-see where this goes. But ‘it’ is not going anywhere. Until there is some sort of boomer liquidation event, which at the soonest will be 5-10 years from now, the demand is going to out-strip the supply and keep the pressure on pricing.
I encourage readers to click on the ‘more…’ button (below) and examine the individual stats by price range. If there is going to be a supply-and-demand problem, it will be on the high-end, where the active-to-pending ratio is back to 10:1. But those sellers are the most equipped to handle it.
Are you wondering if our local housing market could maintain current pricing – or even go higher? It’s possible, and if it happens, a major reason will be baby boomers pitching in to help their kids buy a home.
Compare the 2018-2022 era to what’s expected to happen over the next 20 years (chart above).
And then there’s this:
It’s hard to determine exactly how many buyers are receiving help from their parents, in part because few are willing to discuss how they’re paying for a new home. But financial advisors say they’ve seen a wave of ultra-wealthy parents seeking advice on buying homes for their kids because of the increased gift and estate tax exemption.
The Tax Cuts and Jobs Act doubled the amount that Americans can pass on to heirs tax-free, to about $12 million for individuals and $24 million for couples in 2022. It will sunset at the end of 2025, when the exemption is scheduled to be cut in half.
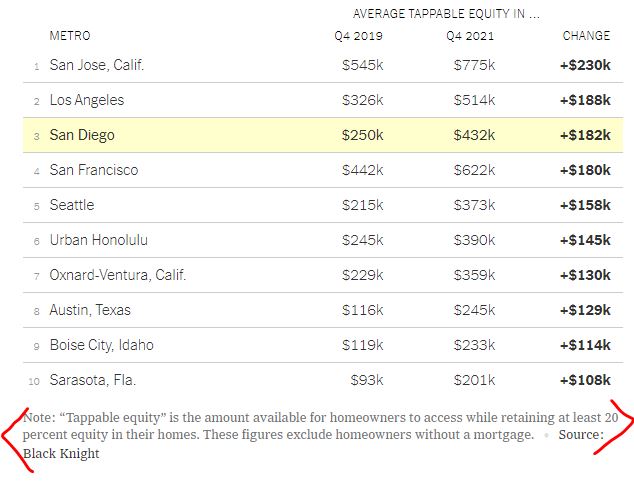
It’s not just for the ultra-wealthy either. Every homeowner has picked up enough additional home equity lately that they might find a way to tap into it to help out their kids:
Unfortunately, the generational wealth transfer will do nothing to add to the supply of homes for sale – it will only create more demand of affluent buyers playing with money that’s been given to them.
The Fed will be forced to keep trying to control inflation, and Rob Dawg thinks mortgage rates will get as high as 7.25% (and they could go higher). It will cause an uncomfortable frenzy-transition period because the longer it takes, the more money will be inherited. Yikes!
With mortgage rates blowing through the fives and another Fed meeting coming up on Wednesday, I think we can declare that the frenzy is over.
Or at least we can expect that it’s over in the buyers’ minds.
But one fact remains the same: There still isn’t anything to buy.
Will there be a surge of new listings? It would be very unlikely. If homeowners weren’t motivated to sell for all-time record prices during ideal conditions, they won’t be interested in the thought of taking less either.
There will be a transition period while buyers, sellers, and agents get comfortable with the new environment. The talking heads will keep reminding us that rates are still historically low, and that buyers have more negotiating power now (up from zero, previously).
By the time we get to the Selling Season of 2023 though, the market players (buyers, sellers, and agents) should establish a decent comfort level with the direction of the variables.
The big question is: What will happen between now and February?
We can probably count on these:
Superior homes that are priced at 10% under recent comps will sell.
Inferior homes that are priced at 20% under recent comps will sell.
Buyers will wait it out, sellers will wait it out, and agents will keep doing what they’ve been doing and ignore anything that’s negative.
Sales will plunge.
Ponder the other likely possibilities:
There are going to be occasional deals, and almost all of them will be on inferior properties. Because all homes will need more improvements to be able to sell for retail, more agents will be inclined to recommend a dump-and-run on the original-looking homes.
There will be a ton of false starts. We are already seeing new listings get cancelled pre-maturely or being refreshed with a new and improved price (but not improved enough to make a difference). There will also be wicked buyer’s remorse as friends and family react violently to those buying now.
Surprisingly, there will be bidding wars and homes selling over their list price. Of the 55 NSDCC houses that have closed in June, 62% of them sold for more than their list price. It’s almost like an addiction!
The market will be driven by the out-of-town buyers who really want and need to live here. They didn’t let higher prices stop them, and neither will higher rates. What are they going to do? Not move here? There might be fewer of them, and they might take longer, but they will keep coming – count on it.
I picked a great day to start the mortgage-rate tracker in the right-hand column! >>>>
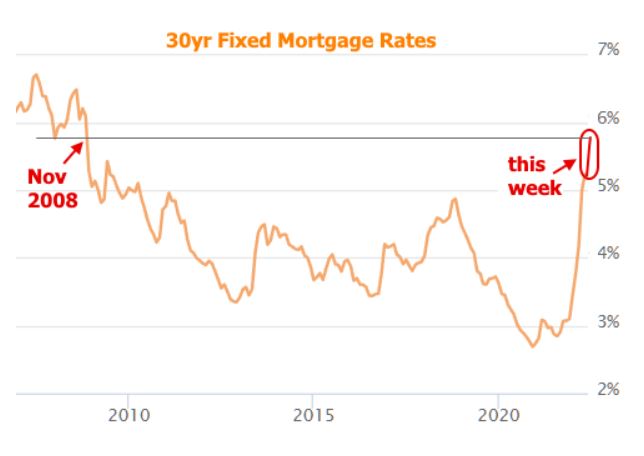
Mortgage rates haven’t been in the 6% range since 2008:
How many agents have operated in a 6% environment? It will be less than half of the active agents today. To check, their license number would have to be around 01850000 or lower (real estate license numbers in California are sequential).
Wondering how to cope? Here are my tips:
Sellers – Offer to Pay Points. Even if the buyer won’t use your lender, offer to pay 1%-2% of the loan amount to buydown their interest rate. If their lender keeps the money instead of giving a lower rate, well then, heck, at least you tried. But the buyers should appreciate the effort, and two points should reduce the rate by at least 1/4%.
Sellers – Carry the Financing. If the seller carries all or part of the financing at a reasonable rate, it will help the buyers. Plus, sellers only pay capital-gains taxes on the money you receive, so you’ll get a break there. The big bonus will be if the buyer stops paying – you’ll get your house back too!
Buyers – Get a Short-Term Mortgage. We call them ARMs, or adjustable-rate mortgages which sounds scary after the neg-am debacle last time. But they offer a fixed-rate for the initial term – just get a seven-year or ten-year loan and refinance once we go into recession and the Feb has to back off again (because they owe $30 trillion themselves, it will probably happen sooner than later).
While the impact on the buyers’ monthly payments is real, it’s the market psychology that will make it worse. Buyers will be expecting lower prices, so instead, consider one of my tips above as an alternative.
Here are graphs that look generally supportive of the local market.
The SP:LP is still well above 100%, though hopefully it will keep receding. Everyone should be happy with it running around 100% or a little under, like it has throughout the history of real estate:
There are more homes for sale – but still low for the selling-season:
June sales are going to be really low, which is fine. Both buyers and sellers have the right to wait for some future date when it might be different (conditions are not likely to change though).
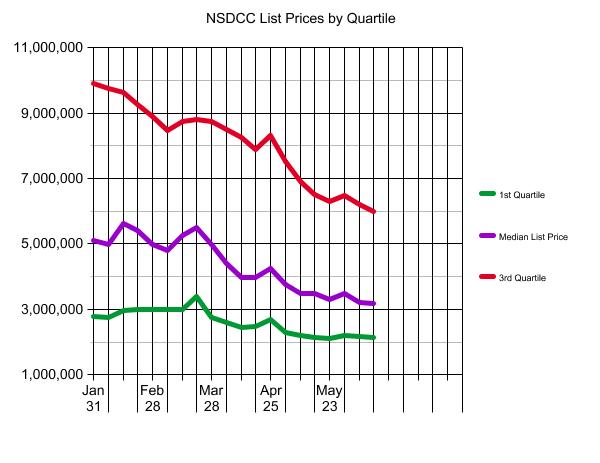
Rapidly-rising prices have decimated the lower-end markets. We’re left with an affluent, higher-end market where buyers and sellers both tend to wait for something better, later:
Check out my new mortgage-rate widget in the right-hand column – we just hit 5.85%! >>>>>>>>>>>>
Trustindex verifies that the original source of the review is Google.
Jim & Donna Klinge helped us sell our home of 30 years in Ocean Hills. We were very happy with their service and would HIGHLY recommend them to anyone looking for an Honest, Knowledgeable, Skilled, Informed Efficient realty team. Both Jim & Donna were so helpful in different ways and complemented each others skills. Please refer to a more detailed review that we wrote on YELP. Thank You Both for all your help!!!
Jesse O'Hara
June 12, 2025
Trustindex verifies that the original source of the review is Google.
A+ thank you
Lisa Tuomi
June 11, 2025
Trustindex verifies that the original source of the review is Google.
Many years ago, we purchased a home in Carlsbad, using a realtor that was recommended to us - Jim Klinge. Fast forward to 2025, we recently had the privilege of selling 2 homes in Carlsbad, CA and didn't hesitate to reach out to Jim and Donna Klinge of Klinge Realty Group to guide us through the sales. The transactions were very different, each with its own unique situation, opportunities and challenges. From start to finish, Donna and Jim helped navigate the pre-sale preparation, the listing, showing of the house, buyer negotiations, the final close and all of the paperwork and decisions in between. What stands out with both transactions is the professionalism of Jim and Donna (and their team), wonderful communication (timely, relevant, concise), their deep understanding of market dynamics (setting realistic expectations), their access to top-notch contractors, and last, their ability to guide us across the finish line successfully. We wouldn't hesitate to use Jim and Donna in the future and highly recommend them for anyone looking to buy or sell a property in North San Diego County.
Jerry Meyer
March 28, 2025
Trustindex verifies that the original source of the review is Google.
We sold a home with Jim and Donna and from beginning to end they were consummate professionals. Their initial walk through the property resulted in a list of items to be repaired or updated. They supplied a list of vendors and job quotes to do the repairs and updates. We originally wanted to sell ‘as is’ and just get it over with. They gave us a selling price for ‘as is’ and options for doing a few updates/repairs to doing it all with the selling price for each option. We agreed to do all they suggested and we sold for the exact price they predicted. For every dollar spent we got back more than $2 back in the selling price. And they got that price in a rising interest rate environment! Donna and Jim are extremely detailed and guide you through ever aspect of the sale. There were no surprises thanks to their guidance. We couldn’t be more pleased with their representation.
Thank you Donna and Jim,
Jerry and Mary
Heather Quejada
March 27, 2025
Trustindex verifies that the original source of the review is Google.
We have known Jim & Donna Klinge for over a dozen years, having met them in Carlsbad where our children went to the same school. As long time North County residents, it was a no- brainer for us to have the Klinges be our eyes and ears for San Diego real estate in general and North County in particular. As my military career caused our family to move all over the country and overseas to Asia, Europe and the Pacific, we trusted Jim and Donna to help keep our house in Carlsbad rented with reliable and respectful tenants for over 10 years.
Naturally, when the time came to sell our beloved Carlsbad home to pursue a rural lifestyle in retirement out of California, we could think of no better team to represent us than Jim and Donna. They immediately went to work to update our house built in 2004 to current-day standards and trends — in 2 short months they transformed it into a literal modern-day masterpiece. We trusted their judgement implicitly and followed 100% of their recommended changes. When our house finally came on the market, there was a blizzard of serious interest, we had multiple offers by the third day and it sold in just 5 days after a frenzied bidding war for 20% above our asking price! The investment we made in upgrades recommended by Jim and Donna yielded a 4-fold return, in the process setting a new high water mark for a house sold in our community.
In our view, there are no better real estate professionals in all of San Diego than Jim and Donna Klinge. Buying or selling, you must run and beg Jim and Donna Klinge to represent you! Our family will never forget Jim, Donna, and their whole team at Compass — we are forever grateful to them.
Lou F
March 27, 2025
Trustindex verifies that the original source of the review is Google.
WeI had the pleasure of working with Klinge Realty Group to sell our home in Carmel Valley, and I cannot recommend them highly enough!
Jim and Donna demonstrated exceptional professionalism, offering expert guidance on market conditions and pricing strategy, which resulted in a quick and successful sale.
Communication was prompt and we were well-informed throughout the entire process.
For anyone looking for a dedicated and knowledgeable real estate team, look no further!
---
William Sams
March 25, 2025
Trustindex verifies that the original source of the review is Google.
Donna and Jim Klinge of Klinge Realty Group have our highest possible recommendation. From Donna and Jim’s first visit to our house through closing their advice and counsel was candid and honest in all dealings. They kept us fully informed throughout the process. The house sold less than three days after listing with a two-week closing. My wife and I have sold several houses during our lives. This was by far the best experience. Klinge Reality is a premium service realtor. You can’t make a better choice for someone to sell your home fast and for top dollar.
Emily Hernandez
December 29, 2024
Trustindex verifies that the original source of the review is Google.
Donna and Jim provided exceptional support and professionalism throughout the entire process. We couldn't have been happier with their efforts. They made our house shine, and thanks to their expertise, it sold above the listing price in the very first weekend! Truly a fantastic experience from start to finish.
Jesus Adrian Sahagun
November 11, 2024
Trustindex verifies that the original source of the review is Google.
This year has been difficult on our family, mainly due to having to sell our home. Thankfully we knew God had a plan for us and working with the Klinge team was a key part of it. It was an obvious decision to work with them again after such an amazing experience when purchasing the same home we needed to sell. The challenge was, how will we do this in so little time with so much going on? Jim and Donna held our hand every step of the way. Whenever an unexpected issue arose they found and provided a solution. Never once did we feel pressured to make a decision and the Klinges were always reassuring after providing the information that the decision was ours to make. Despite the curve balls, they never panicked and exemplified the “can do” attitude, making us feel optimistic and taken care of. Their expertise and professionalism was superb. But of all the reasons to work with the Klinges, the most impactful and valuable is their compassion and genuine care for their clients. We pray that we can one day purchase our forever home and you better believe that Jim and Donna will be representing us - as long as they will have us of course. Thank you again Klinge team! Your execution, experience, and care are unmatched.
SABIHA PASHA
July 23, 2024
Trustindex verifies that the original source of the review is Google.
Jim and Donna were fantastic! Jim understanding my needs, recommending potential places, pointing out the pros and cons of each property was invaluable. Then when the offer was accepted Donna’s organized guidance through the inspections, paperwork etc made the whole process seem effortless.
So grateful that I had them on my side!