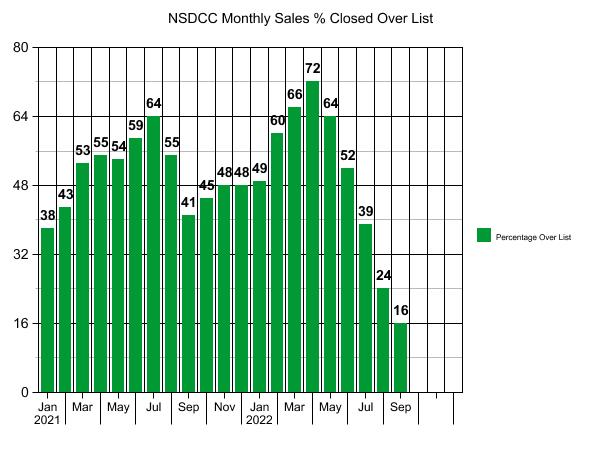
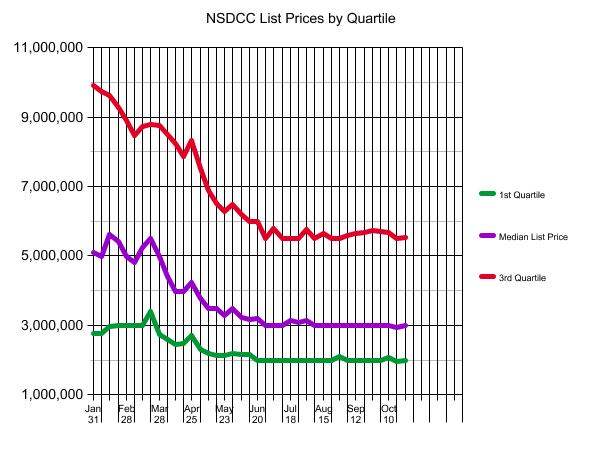
BOTH THE AVERAGE AND MEDIAN SALES PRICES ARE -23% SINCE MARCH.
We saw that the difference needed to fully compensate for the higher rates is -30%. We’re almost there, and the full effect should be built in by springtime!
Please note that I didn’t say home prices are down 23%.
The median sales price is 23% lower than it was six months ago.
When it comes to selling your home, there are a few strategies to consider – and the most important point is to select one, any one!
There is the old traditional PPP plan – Put it in the MLS, Put a sign in the yard, and Pray.
My favorite is to spruce it up, price it right, and have a great realtor sell it promptly.
But a third option is available that is sort of a hybrid of the two.
If you worry that pricing attractively might leave some money on the table (mostly because you lack confidence in your realtor’s ability to conduct a proper bidding war), and really want to start at your aspirational price and hope for the best, then consider this plan.
List Your Home With Two Planned Price Reductions Built In
Generally speaking, the problem with price reductions is that sellers and agents don’t make them big enough to impress the buyers, and hence, you’re just throwing money away. Dropping the price in any amount does get you back on the realtor hotsheet for the day, but we are more annoyed than impressed with sellers who are dinking around over a few thousand dollars when we’re trying to sell a house today.
The amount of the perfect price reduction is 5% of the list price.
It follows my regular guideline of knowing when your list price is right:
List-Price Accuracy Gauge
If you are getting showings and offers, your price is about right.
If you are getting showings, but no offers, then your price is about 5% wrong.
If you’re not getting any showings, your price is at least 10% wrong.
It’s just common sense. If no one is coming around, it’s because buyers think that the price is way off, based on how the home is being presented. There is a glimmer of hope that improving the presentation might get some lookers, but in this market, once buyers take one look at the listing, they will cast you aside and forget all about you unless there is a drastic change in price.
I’ll understand if you don’t want to commit to any price reductions today – heck, you haven’t even signed the listing agreement yet.
But hear me out.
There will be an initial burst of activity once the listing hits the MLS – everybody jumps on the fresh meat, and hopes they are reading the presentation/price combo correctly.
But after 7-10 days, it will be crickets. Showings dry up like an old peach seed!
Plan for two price reductions in advance as a strategy to re-energize the urgency. Put it right in the listing agreement that the price is to be reduced by 5% on Day 14, and another 5% on Day 24.
As long as the initial list price wasn’t more than 10% crazy, then this strategy will get you into escrow within 30 days. If you let the listing languish for more than a month, it will only invite the lowballers, and they will be hacking off more than 10%.
If you are on the fence about how to sell your house, and you don’t really need to sell anyway, here’s one reason to go all in and sell on the first try.
You sure don’t want to fail, and be an expired listing.
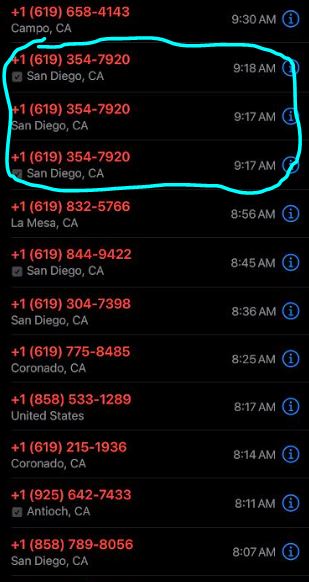
You remember our sellers who decided to rent their house, rather than be victimized by the blunder up the street. I warned them that on the day my listing shows up as expired on the MLS, there would be 100s of realtors descending upon them.
Their phone number was unlisted, and it was never mentioned in the MLS, but it doesn’t matter – any phone number can be found. Around 7am that morning, the calls started, and as you can see above, he was getting one about every five minutes.
Check the agent who called him three times in one minute!
You don’t ever want to be an expired listing. Your phone will melt down, and you will seriously consider getting a new phone number. The mail you’ll receive killed several trees, and the in-person hounding at your door will be offensive too.
I apologize on behalf of the realtor industry in advance.
Another reason to make sure you sell the first time around!
By now, it’s obvious that I’m a proponent of attractive pricing that creates instant urgency and a quick sale. Those who can properly handle a bidding war can work with the contestants to find top dollar, and I’ve found that it’s literally easier to go up on price, than down.
The more traditional plan of pricing high with the idea that “you can always come down later” has been the pattern for so long that most people don’t even question its effectiveness.
Here is a classic example – even after dropping from $2,995,000 to $2,199,000, it took another two months before they found the buyer, and more discounting before they settled on the sales price:
You can spruce up the house (for best results, do everything) and price attractively to create maximum urgency and sell for top dollar quickly, or you can do nothing, list for a retail price, and let the market have its way with you.
“The forceful deceleration in U.S. housing prices that we noted a month ago continued in our report for August 2022,” says Craig J. Lazzara, Managing Director at S&P DJI. “For example, the National Composite Index rose by 13.0% for the 12 months ended in August, down from its 15.6% year-over-year growth in July. The -2.6% difference between those two monthly rates of change is the largest deceleration in the history of the index (with July’s deceleration now ranking as the second largest). We see similar patterns in our 10-City Composite (up 12.1% in August vs. 14.9% in July) and our 20-City Composite (up 13.1% in August vs. 16.0% in July). Further, price gains decelerated in every one of our 20 cities. These data show clearly that the growth rate of housing prices peaked in the spring of 2022 and has been declining ever since.
“Month-over-month comparisons are consistent with these observations. All three composites declined in July, as did prices in every one of our 20 cities. On a month-over-month basis, the biggest declines occurred on the west coast, with San Francisco (-4.3%), Seattle (-3.9%), and San Diego (-2.8%) falling the most.
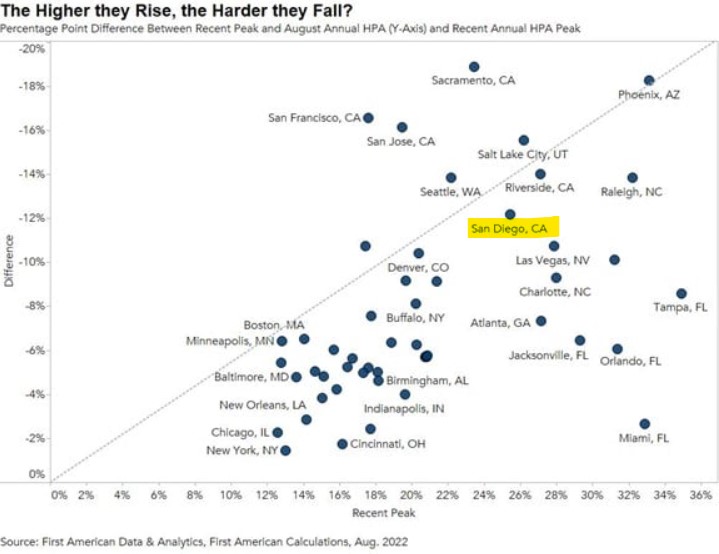
The local Case-Shiller index is due tomorrow, and expectations are for a 2% drop from June. First American has their own repeat-sales index which is already showing a 12% decline in San Diego pricing (above).
While the -12% over six months is probably a surprise to people who think pricing is downward sticky, it’s different this time. In the past, the home-equity positions were much smaller, and many sellers had hold out just to have enough for a steak dinner at closing.
None of today’s sellers need to hold out. All of them could sell today for what the market will bear, if they could just get out of their own way. Yes, it’s true that they may have plans for all the money and need to sell for their price, and those sellers should just wait it out.
This could be over before you know it.
Is there a specific marker for home buyers to know when it’s time to buy? Or is it just when prices go down?
Is the -12% enough to get the attention of the highly-motivated buyers – those who don’t own a house yet?
Or will they just look up in March/April and say, “Close enough!”
Between trying to watch the Padres game on my phone and the crowds of people looking at the house yesterday, I couldn’t get any more footage than this:
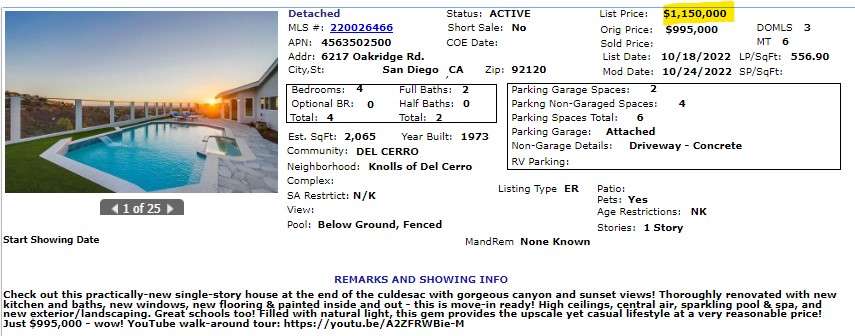
After having roughly 300 people attend the two open houses, we have received 14 offers!
We have countered all of the offers because agents don’t know who will go higher – why limit the seller response to just the top 3 or 5 offers? We countered $1,150,000 to every buyer to narrow down the group of contenders willing to go to at least that amount, and then I’ll do the jimjamalama.
Stay Tuned!
We did adjust the price upward this morning to alert the newcomers to our new starting point:
There were a few comments, mostly from neighbors, that accused me of deliberately starting with an ultra-low price to attract more people. Given the recent sales nearby, the current market conditions, and especially the active listings sitting around unsold, I thought it was an attractive price. I never fear pricing too low because I know how to handle a fair bidding process so everyone has a chance to pay top dollar.
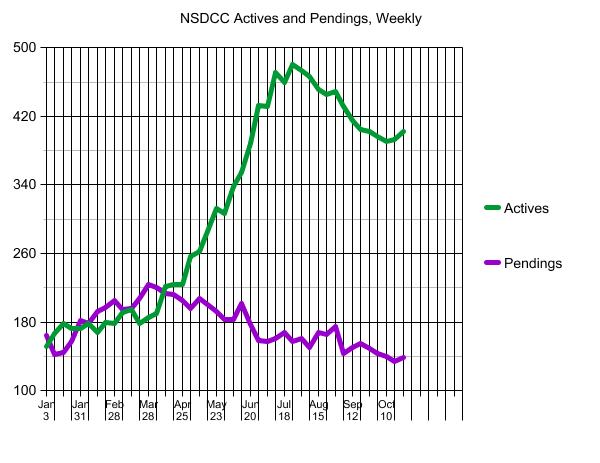
What does an uptick in both actives and pendings mean?
The local market has finally succumbed to the trend of higher inventory and declining interest, or
We’ve hit bottom!
After the beating the market has taken over the last 3-4 months, you’d think sellers would be discouraged and just wait until the 2023 Spring Selling Season. But where will mortgage rates be then?
The 50 new NSDCC listings in the last week were the most since the week of August 15th, but nineteen of those had been on the market previously and were ‘refreshed’. So this probably isn’t the flood of inventory that could change everything. Or is it?
Trustindex verifies that the original source of the review is Google.
A+ thank you
Lisa Tuomi
June 11, 2025
Trustindex verifies that the original source of the review is Google.
Many years ago, we purchased a home in Carlsbad, using a realtor that was recommended to us - Jim Klinge. Fast forward to 2025, we recently had the privilege of selling 2 homes in Carlsbad, CA and didn't hesitate to reach out to Jim and Donna Klinge of Klinge Realty Group to guide us through the sales. The transactions were very different, each with its own unique situation, opportunities and challenges. From start to finish, Donna and Jim helped navigate the pre-sale preparation, the listing, showing of the house, buyer negotiations, the final close and all of the paperwork and decisions in between. What stands out with both transactions is the professionalism of Jim and Donna (and their team), wonderful communication (timely, relevant, concise), their deep understanding of market dynamics (setting realistic expectations), their access to top-notch contractors, and last, their ability to guide us across the finish line successfully. We wouldn't hesitate to use Jim and Donna in the future and highly recommend them for anyone looking to buy or sell a property in North San Diego County.
Jerry Meyer
March 28, 2025
Trustindex verifies that the original source of the review is Google.
We sold a home with Jim and Donna and from beginning to end they were consummate professionals. Their initial walk through the property resulted in a list of items to be repaired or updated. They supplied a list of vendors and job quotes to do the repairs and updates. We originally wanted to sell ‘as is’ and just get it over with. They gave us a selling price for ‘as is’ and options for doing a few updates/repairs to doing it all with the selling price for each option. We agreed to do all they suggested and we sold for the exact price they predicted. For every dollar spent we got back more than $2 back in the selling price. And they got that price in a rising interest rate environment! Donna and Jim are extremely detailed and guide you through ever aspect of the sale. There were no surprises thanks to their guidance. We couldn’t be more pleased with their representation.
Thank you Donna and Jim,
Jerry and Mary
Heather Quejada
March 27, 2025
Trustindex verifies that the original source of the review is Google.
We have known Jim & Donna Klinge for over a dozen years, having met them in Carlsbad where our children went to the same school. As long time North County residents, it was a no- brainer for us to have the Klinges be our eyes and ears for San Diego real estate in general and North County in particular. As my military career caused our family to move all over the country and overseas to Asia, Europe and the Pacific, we trusted Jim and Donna to help keep our house in Carlsbad rented with reliable and respectful tenants for over 10 years.
Naturally, when the time came to sell our beloved Carlsbad home to pursue a rural lifestyle in retirement out of California, we could think of no better team to represent us than Jim and Donna. They immediately went to work to update our house built in 2004 to current-day standards and trends — in 2 short months they transformed it into a literal modern-day masterpiece. We trusted their judgement implicitly and followed 100% of their recommended changes. When our house finally came on the market, there was a blizzard of serious interest, we had multiple offers by the third day and it sold in just 5 days after a frenzied bidding war for 20% above our asking price! The investment we made in upgrades recommended by Jim and Donna yielded a 4-fold return, in the process setting a new high water mark for a house sold in our community.
In our view, there are no better real estate professionals in all of San Diego than Jim and Donna Klinge. Buying or selling, you must run and beg Jim and Donna Klinge to represent you! Our family will never forget Jim, Donna, and their whole team at Compass — we are forever grateful to them.
Lou F
March 27, 2025
Trustindex verifies that the original source of the review is Google.
WeI had the pleasure of working with Klinge Realty Group to sell our home in Carmel Valley, and I cannot recommend them highly enough!
Jim and Donna demonstrated exceptional professionalism, offering expert guidance on market conditions and pricing strategy, which resulted in a quick and successful sale.
Communication was prompt and we were well-informed throughout the entire process.
For anyone looking for a dedicated and knowledgeable real estate team, look no further!
---
William Sams
March 25, 2025
Trustindex verifies that the original source of the review is Google.
Donna and Jim Klinge of Klinge Realty Group have our highest possible recommendation. From Donna and Jim’s first visit to our house through closing their advice and counsel was candid and honest in all dealings. They kept us fully informed throughout the process. The house sold less than three days after listing with a two-week closing. My wife and I have sold several houses during our lives. This was by far the best experience. Klinge Reality is a premium service realtor. You can’t make a better choice for someone to sell your home fast and for top dollar.
Emily Hernandez
December 29, 2024
Trustindex verifies that the original source of the review is Google.
Donna and Jim provided exceptional support and professionalism throughout the entire process. We couldn't have been happier with their efforts. They made our house shine, and thanks to their expertise, it sold above the listing price in the very first weekend! Truly a fantastic experience from start to finish.
Jesus Adrian Sahagun
November 11, 2024
Trustindex verifies that the original source of the review is Google.
This year has been difficult on our family, mainly due to having to sell our home. Thankfully we knew God had a plan for us and working with the Klinge team was a key part of it. It was an obvious decision to work with them again after such an amazing experience when purchasing the same home we needed to sell. The challenge was, how will we do this in so little time with so much going on? Jim and Donna held our hand every step of the way. Whenever an unexpected issue arose they found and provided a solution. Never once did we feel pressured to make a decision and the Klinges were always reassuring after providing the information that the decision was ours to make. Despite the curve balls, they never panicked and exemplified the “can do” attitude, making us feel optimistic and taken care of. Their expertise and professionalism was superb. But of all the reasons to work with the Klinges, the most impactful and valuable is their compassion and genuine care for their clients. We pray that we can one day purchase our forever home and you better believe that Jim and Donna will be representing us - as long as they will have us of course. Thank you again Klinge team! Your execution, experience, and care are unmatched.
SABIHA PASHA
July 23, 2024
Trustindex verifies that the original source of the review is Google.
Jim and Donna were fantastic! Jim understanding my needs, recommending potential places, pointing out the pros and cons of each property was invaluable. Then when the offer was accepted Donna’s organized guidance through the inspections, paperwork etc made the whole process seem effortless.
So grateful that I had them on my side!
Anu Koberg
July 13, 2024
Trustindex verifies that the original source of the review is Google.
We first found Jim through his blog at bubbleinfo.com, which really showcased his knowledge of SoCal real estate. Since then we've done three transactions with Jim and Donna, and they are an incredible full service agency, with Jim's deep market insight and Donna's deft contract and project management. We trust them implicitly in their analysis and strategy, which is based on years of experience. They're always available and on top of things, and we strongly recommend them to anyone.