The trend of paying over the list price is increasing.
NSDCC Detached-Home Sales Closed Over List Price
January: 38%
February: 43%
March: 51% (of the first 75 closed sales of the month)
Most sellers and agents are happy just to get 1% to 5% over list which will cover some or all of the commission. There were only four that went double-digit over:
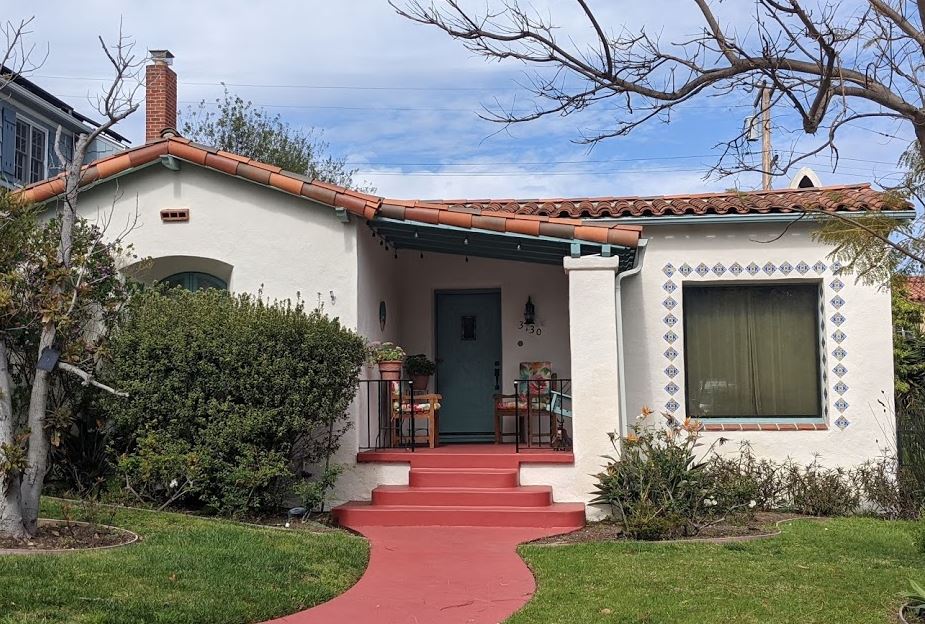
This Brentwood Heights culdesac home on a 27,007sf lot in Olde Carlsbad had one of the better granny flats – and was hotly contested. We were hoping to talk the seller into paying off the $259/mo. solar lease, but he probably didn’t have to. It closed today for $1,625,000 cash:
John Townes Van Zandt[1] (March 7, 1944 – January 1, 1997) was an American singer-songwriter. He wrote numerous songs, such as “Pancho and Lefty”, “For the Sake of the Song”, “Tecumseh Valley”, “Rex’s Blues”, and “To Live Is to Fly”, that are widely considered masterpieces of American songwriting. His musical style has often been described as melancholy and features rich, poetic lyrics. During his early years, Van Zandt was respected for his guitar playing and fingerpicking ability.
In 1983, six years after Emmylou Harris had first popularized it, Willie Nelson and Merle Haggard covered his song “Pancho and Lefty”, reaching number one on the Billboard country music chart. Much of Van Zandt’s life was spent touring various dive bars, often living in cheap motel rooms and backwood cabins. For much of the 1970s, he lived in a simple shack without electricity or a telephone.
His influence has been cited by countless artists across multiple genres, and his music has been recorded or performed by Bob Dylan, Willie Nelson, Lyle Lovett, Merle Haggard, Norah Jones, Emmylou Harris, Counting Crows, Steve Earle, Robert Earl Keen Jr., Nanci Griffith, Guy Clark, Wade Bowen, Gillian Welch, Pat Green, Colter Wall, Jason Isbell, Calvin Russell, Natalie Maines, and Frank Turner.
I have recently stumbled upon your blog and find it very interesting as I am an appraiser in San Diego. I wonder if anyone has considered that the low inventory levels are in part because home prices are going up so fast why would anyone want to sell something that is going to be worth 10K, 20K, 50K more within just months. For example my home according to Zillow is up 22K in the last 30 days. Something else to consider that I have not seen mentioned….
Are sellers paying attention that closely? If so, then you’re right – it’s possible. Add that extra supply to the post-covid/Prop-19/usual-spring listings and there could be a real surge. But the worst thing that will happen is there will be 3-4 houses for sale in your neighborhood, instead of one or two.
Do sellers risk it? Most are already making $200,000 to $1,000,000+ profit……are they going to purposely hold out in hopes of picking up an extra $50,000? Maybe, but I’d guess that when and where they are moving probably plays a bigger role in their decision-making.
~~~~~~~~~~~~~~~~~~~~~~~~~~~~~~~~~~~~~~
Sellers are indeed holding back for some reason.
In the first nine days of March last year we had 148 new listings between La Jolla and Carlsbad, and so far we’ve only had 90 this year. More will be added to that nine-day total this week, but we’re still well under where we’ve been in previous years. March is when the inventory really picks up, historically:
~~~~~~~~~~~~~~~~~~~~~~~~~~~~~~~~~~~~~~~~~~~~
The Frenzy of 2013 was red-hot for about a year. If the same happens this time, it means the market should flatten out by July as rates increase and buyer exhaustion sets in.
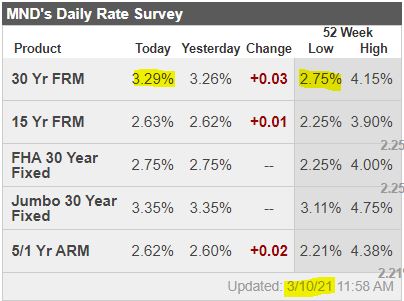
~~~~~~~~~~~~~~~~~~~~~~~~~~~~~~~~~~~~~~~~~~~~
The bump in rates over the last two weeks just threw gasoline on the fire for those who could find a house to buy. But an extended run-up – especially if we get to 4% – should cool things off.
~~~~~~~~~~~~~~~~~~~~~~~~~~~~~~~~~~~~~~~~~~~~
I have two closings with buyers this week. One paid $135,000 over list, and the other paid $100,000 over.
~~~~~~~~~~~~~~~~~~~~~~~~~~~~~~~~~~~~~~~~~~~~
Over the weekend, I had buyers make a highest-and-best offer that was $207,000 over list….and lost.
~~~~~~~~~~~~~~~~~~~~~~~~~~~~~~~~~~~~~~~~~~~~
There is virtually no transparency – just take your shot and pray. Don’t think, and don’t blink!
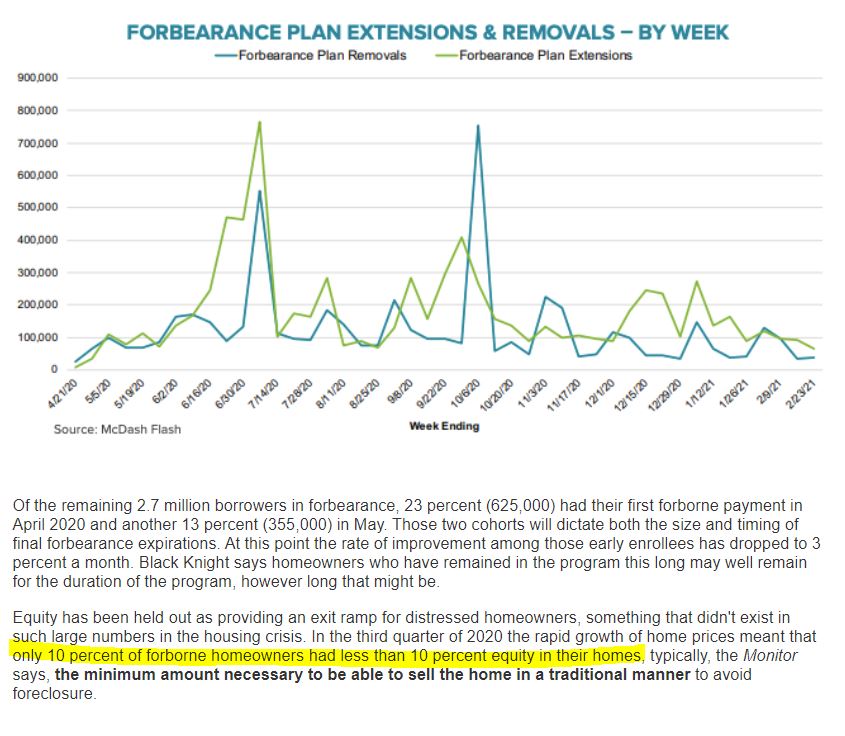
We can guess that close to none of the San Diego County homeowners in forbearance have less then 10% equity – heck, they’ve picked up that much since Christmas!
My guess was that we’d have 10% MORE listings this year, as a result of there being a few more reasons to move – covid letting up, Prop 19, forbearance expiration, etc. Instead, we have covid hanging around, Prop 19 has been a dud, and forbearances have been extended through the year.
With 19% FEWER listings (so far), the impact shifts to pricing, and we see rapidly-rising home prices instead. We need more people leaving, and fewer people coming, to balance it out – and price will fix that too!
Hat tip to CP for sending this in this report from CPL:
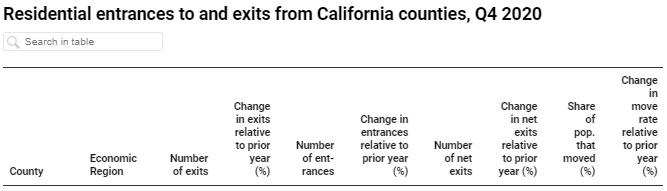
Recent news reports, preliminary data, and anecdotes suggest the COVID-19 pandemic is either causing or accelerating an exodus from California. The extent of any such exodus, and whether it proves to be temporary or permanent, is not yet clear — at least not in data sources traditionally used to quantify residential mobility.
The stakes are high: significant population shifts could affect the size and composition of regional labor markets as well as rent and home values. Some fear that mass departures by the state’s wealthy could reduce local and state tax revenues, potentially affecting the services governments are able to provide for years to come.
This policy brief uses the University of California Consumer Credit Panel (UC-CCP), a new dataset containing residential locations for all Californians with credit history, to track domestic residential moves at a quarterly frequency through the end of 2020.
For the full report of every county in California, click here:
A move is defined as having a different ZIP code in the next quarter. The data universe for this analysis is individuals in the UC-CCP with credit history; this population is older, more financially advantaged, and less diverse than the population of all adults in California.who had a different zip code on their credit report.